Vapor supports several different ways of visualizing 3D variables. Volume rendering enables a variable to be seen as a partially transparent density. Other supported 3D visualization methods include isosurfaces (using the Iso panel) or contour planes (using the Probe panel). In this section we show how to use volume rendering to look at wind speed.
Return to the starting viewpoint by clicking on the "Home" icon at the top of the screen. Set the time step to 10 (that is 10 AM on 8/29/2005, around the time of Katrina's landfall). Click on the DVR tab (that stands for Direct Volume Rendering). Near the top of the DVR tab, in the Variable selector, select UVW (wind speed) as the variable.
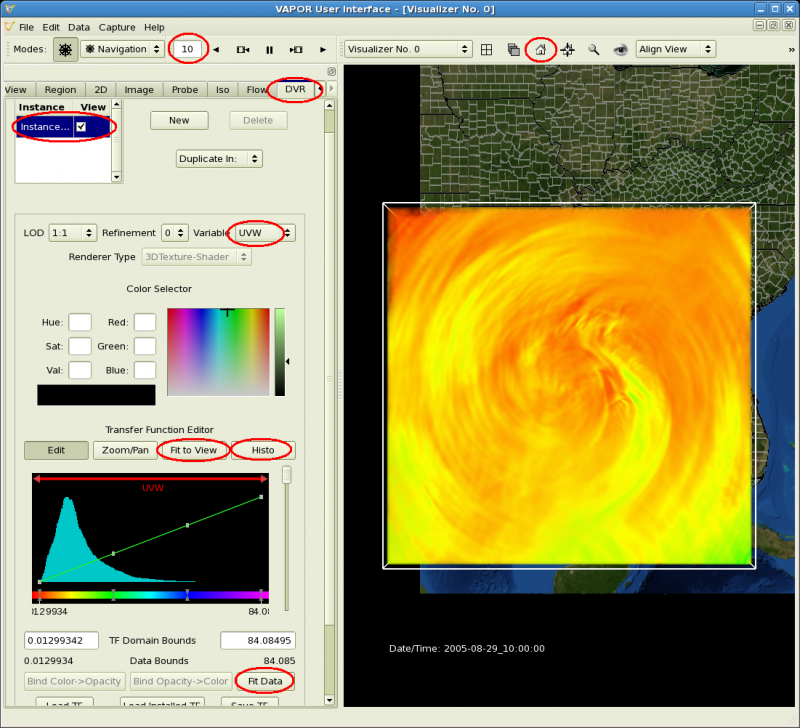
Scroll down to the bottom of the DVR panel, below the panel entitled "Transfer Function Editor". Click the button labeled "Fit Data" on the right near the bottom of the DVR tab. Click the buttons "Fit to View" and "Histo" in the Transfer function editor. Check the "Instance:1" checkbox to enable volume rendering. You will see an image like the following (where the GUI settings we discussed are circled in red):