If you do not yet have the Katrina data, You can obtain this data (in 58 g-zipped files) from ftp://ftp.ucar.edu/vapor/data/Katrina .
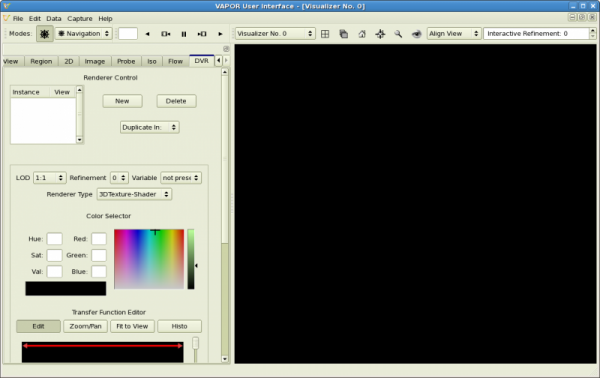
To launch the VAPOR user interface, execute the command "vaporgui" (or click the vapor icon![]() ). You will see the VAPOR user interface:
). You will see the VAPOR user interface:
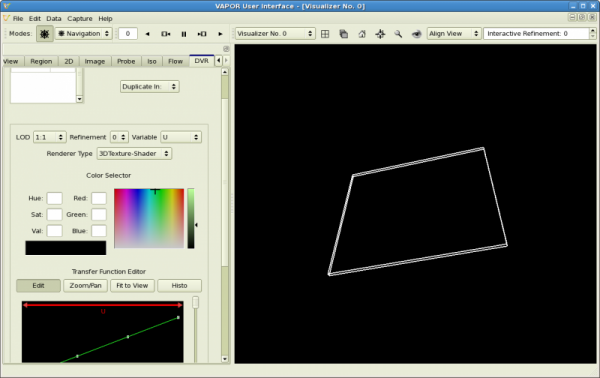
From the "Data" menu at the top of the vapor window, click on "Import data into current session"and choose "WRF-ARW". Then select all of the Katrina wrfout_d02 files you will be visualizing. [Alternatively, if you have converted the WRF data to a vapor VDC, you can click on the Data menu entry "Load a Dataset into Current Session", and select the file "Katrina.vdf".] VAPOR will display a rectangular box in the scene, indicating the bounds of the current region. If you drag in the scene with the left mouse button you will rotate the box:
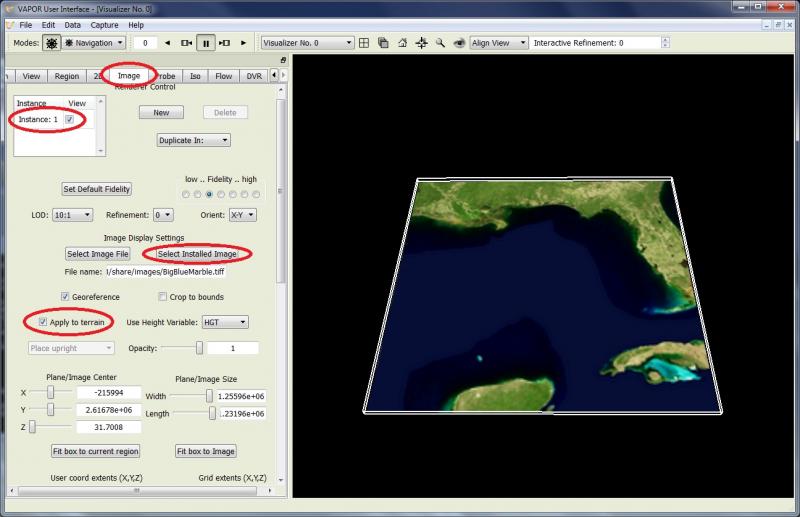
To display geo-Tiff images for this scene, click the "Image" tab at the top left of the user interface. Click on the button "Select Installed Image" and select the file "BigBlueMarble.tiff". [Alternatively, if you have obtained a geo-referenced terrain image "KatrinaTerrain.tiff", you should click the button "Select Image File" and select the KatrinaTerrain.tiff file.]
The resulting image to be displayed is shown in the scene as follows:
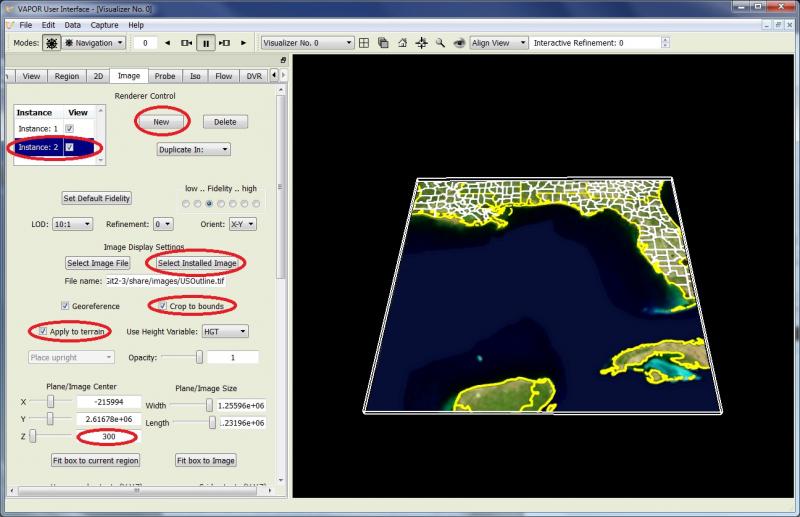
Next we can insert a political boundary image into this scene. At the top of the Image tab, click the "New" button to create a new image instance. At the top left of the Image tab, click the "Instance:2" button to select the new instance. Click the "Select Installed Image" button, and then select the file "USOutline.tif". [Alternatively, if you retrieved a georeferenced image "KatrinaCounties.tiff", then click the "Select Image File" button and select the "KatrinaCounties.tiff" file.] Check the "Apply image to terrain" checkbox. Then check "Instance:2" at the top of the tab. Also check the box "Crop to bounds" so that the image will not extend outside the region where we have data. These GUI elements are circled in the image below.
You will not yet see the county lines because they are not above the terrain image. To move the county line image slightly above the terrain image, type the number 300 as the Z coordinate of Plane/Image center, on the left side of the Image tab, and press "enter". You will see the following image with county boundaries above the terrain:
Extending the images to cover the full path of Katrina.
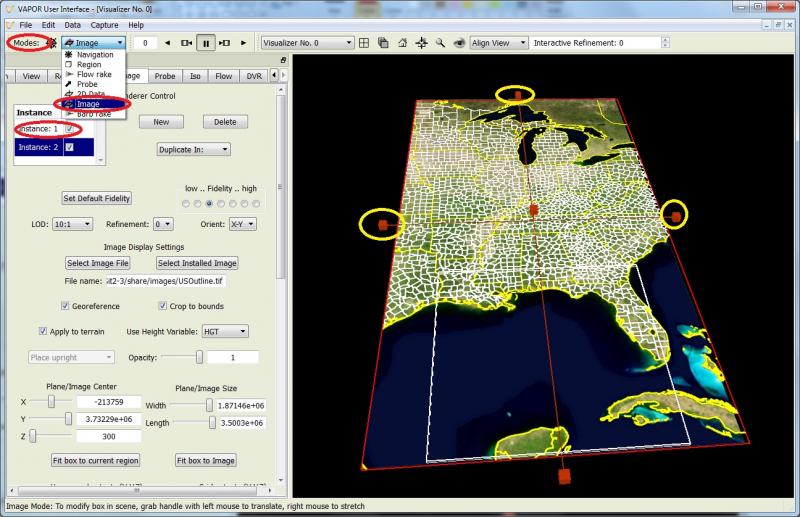
The above terrain images only cover the region of WRF data at the current time steps. We can extend these images to cover the full path taken by Katrina. At the top of the VaporGUI window, there is a Mode selector button (next to the text "Modes"). Click, and select "Image" mode. Note that the image now is enclosed by a red box, with cube-shaped handles in the middle of each edge of the box. In Image mode, we can control the extents of the image by dragging the red handles with the right mouse button.
With the right mouse button, drag the north edge of the box further north, to where the box contains the Great Lakes. Then drag the east edge to the right, to include most of Cuba, and drag the west edge further to the west, including part of Texas. Now the state/county map covers the full path of Katrina.
Then select the first image instance (the instance associated with the Blue Marble image). Again drag the handles with the right mouse, so that the extents of the Blue Marble image become as large as the state/county map image. [In the image below we have circled the handles that are dragged with yellow rings. Also red ovals identify the settings made in the GUI. Your scene will display the extended terrain images: