This notebook illustrates how to make diagnostic plots using the MAAG dataset hosted on NCAR’s Geoscience Data Exchange (GDEX).
The Mesoamerica Affinity Group (MAAG) dataset is a 2-week convection-permitting simulation of Hurricane Maria (2017) run with the Model for Prediction Across Scales – Atmosphere (MPAS-A) on a novel variable-resolution 15→3 km mesh centered over Central America and the Caribbean, forced by ERA5. It is described in Núñez Ocasio et al. (2026, BAMS).
What this notebook does
We reproduce a scaled-down version of Fig. 3 of Núñez Ocasio et al. (2026): the accumulated rainfall as Hurricane Maria crossed Puerto Rico, 19–21 Sep 2017. Because the regridded domain is regional and only ~2 weeks of hourly data, the whole workflow runs comfortably on a single machine — no Dask cluster required.
# Imports
import numpy as np
import xarray as xr
import matplotlib.pyplot as plt
import cartopy.crs as ccrs
import cartopy.feature as cfeature
from matplotlib.colors import ListedColormap, BoundaryNorm
Accessing MAAG through GDEX
Like other GDEX collections, MAAG is served through a kerchunk
reference layer over the underlying NetCDF files, so a single
xr.open_dataset(..., engine="kerchunk") call exposes the regridded archive as a
virtual xarray.Dataset.
# GDEX kerchunk reference for the MAAG regridded (deg.25) product, served over HTTPS
kerchunk_url = "https://data.gdex.ucar.edu/d010077/kerchunk/deg.25_diag-remote-osdf.json"
print(kerchunk_url)
https://data.gdex.ucar.edu/d010077/kerchunk/deg.25_diag-remote-osdf.json
ds = xr.open_dataset(kerchunk_url, engine="kerchunk")

# Inspect what's actually in the regridded product: dims, coords, and variable names
print("Dimensions:", dict(ds.sizes))
print("Coordinates:", list(ds.coords))
print("Data variables:")
for v in ds.data_vars:
    print(f"  {v:20s} {ds[v].dims}  {ds[v].attrs.get('long_name','')}")
ds
/glade/u/home/harshah/.conda/envs/osdf/lib/python3.11/site-packages/tqdm/auto.py:21: TqdmWarning: IProgress not found. Please update jupyter and ipywidgets. See https://ipywidgets.readthedocs.io/en/stable/user_install.html
from .autonotebook import tqdm as notebook_tqdm
Dimensions: {'xtime': 361, 'lat': 720, 'lon': 1440, 't_iso_levels': 27, 'u_iso_levels': 27, 'z_iso_levels': 27}
Coordinates: ['xtime', 'lat', 'lon', 't_iso_levels', 'u_iso_levels', 'z_iso_levels']
Data variables:
  dtheta_dt_mp_isobaric ('xtime', 'lat', 'lon', 't_iso_levels')  Potential temperature heating rate from microphysics interpolated to isobaric surfaces defined in t_iso_levels
  hfx                  ('xtime', 'lat', 'lon')  upward heat flux at the surface
  mslp                 ('xtime', 'lat', 'lon')  Mean sea-level pressure
  olrtoa               ('xtime', 'lat', 'lon')  all-sky top-of-atmosphere outgoing longwave radiation flux
  quantization_info    ('xtime',)
  qv_isobaric          ('xtime', 'lat', 'lon', 't_iso_levels')  Water vapor mixing ratio interpolated to isobaric surfaces defined in t_iso_levels
  rainc                ('xtime', 'lat', 'lon')  accumulated convective precipitation
  rainnc               ('xtime', 'lat', 'lon')  accumulated total grid-scale precipitation
  relhum_700hPa        ('xtime', 'lat', 'lon')  Relative humidity vertically interpolated to 700 hPa
  relhum_850hPa        ('xtime', 'lat', 'lon')  Relative humidity vertically interpolated to 850 hPa
  rh_isobaric          ('xtime', 'lat', 'lon', 't_iso_levels')  Relative humidity interpolated to isobaric surfaces defined in t_iso_levels
  rhod_isobaric        ('xtime', 'lat', 'lon', 't_iso_levels')  dry air density interpolated to isobaric surfaces defined in t_iso_levels
  rthblten_isobaric    ('xtime', 'lat', 'lon', 't_iso_levels')  tendency of potential temperature due to pbl processes interpolated to isobaric surfaces defined in t_iso_levels
  rthratenlw_isobaric  ('xtime', 'lat', 'lon', 't_iso_levels')  tendency of potential temperature due to long wave radiation interpolated to isobaric surfaces defined in t_iso_levels
  rthratensw_isobaric  ('xtime', 'lat', 'lon', 't_iso_levels')  tendency of potential temperature due to short wave radiation interpolated to isobaric surfaces defined in t_iso_levels
  t_isobaric           ('xtime', 'lat', 'lon', 't_iso_levels')  Temperature interpolated to isobaric surfaces defined in t_iso_levels
  temperature_925hPa   ('xtime', 'lat', 'lon')  Temperature vertically interpolated to 925 hPa
  umeridional_500hPa   ('xtime', 'lat', 'lon')  Reconstructed meridional wind at cell centers, vertically interpolated to 500 hPa
  umeridional_700hPa   ('xtime', 'lat', 'lon')  Reconstructed meridional wind at cell centers, vertically interpolated to 700 hPa
  umeridional_850hPa   ('xtime', 'lat', 'lon')  Reconstructed meridional wind at cell centers, vertically interpolated to 850 hPa
  umeridional_isobaric ('xtime', 'lat', 'lon', 'u_iso_levels')  Meridional wind interpolated to isobaric surfaces defined in u_iso_levels
  uzonal_500hPa        ('xtime', 'lat', 'lon')  Reconstructed zonal wind at cell centers, vertically interpolated to 500 hPa
  uzonal_700hPa        ('xtime', 'lat', 'lon')  Reconstructed zonal wind at cell centers, vertically interpolated to 700 hPa
  uzonal_850hPa        ('xtime', 'lat', 'lon')  Reconstructed zonal wind at cell centers, vertically interpolated to 850 hPa
  uzonal_isobaric      ('xtime', 'lat', 'lon', 'u_iso_levels')  Zonal wind interpolated to isobaric surfaces defined in u_iso_levels
  w_700hPa             ('xtime', 'lat', 'lon')  Vertical velocity vertically interpolated to 700 hPa
  w_850hPa             ('xtime', 'lat', 'lon')  Vertical velocity vertically interpolated to 850 hPa
  w_isobaric           ('xtime', 'lat', 'lon', 'u_iso_levels')  Vertical wind interpolated to isobaric surfaces defined in u_iso_levels
  z_isobaric           ('xtime', 'lat', 'lon', 'z_iso_levels')  Height interpolated to isobaric surfaces defined in z_iso_levels
Accumulated rainfall during Maria’s passage
MPAS accumulates precipitation from the start of the run, split into convective
(rainc) and grid-scale (rainnc) components. On this convection-permitting
mesh the resolved rainnc dominates, and total precipitation is their sum.
To get the rainfall that fell during a window, we subtract the accumulation at the start of the window from the accumulation at the end. Hurricane Maria’s eye crossed Puerto Rico on 20 Sep 2017, so we use a 19–21 Sep window.
%%time
total_accum = ds["rainc"] + ds["rainnc"]      # mm, accumulated since run start

t0 = np.datetime64("2017-09-19T00")           # Maria approaching Puerto Rico
t1 = np.datetime64("2017-09-21T23")           # after the eye has passed

storm_total = (total_accum.sel(xtime=t1) - total_accum.sel(xtime=t0)).compute()

# The grid is 0–360°; shift to −180..180 so the Caribbean has negative lons
storm_total = storm_total.assign_coords(lon=((storm_total.lon + 180) % 360) - 180).sortby("lon")

# The global field is NaN outside the MAAG footprint — sanity-check over Puerto Rico
pr = storm_total.sel(lat=slice(16.5, 19.5), lon=slice(-69, -63))
print(f"Puerto Rico window — max storm total: {float(pr.max()):.0f} mm")
storm_total
Puerto Rico window — max storm total: 421 mm
CPU times: user 194 ms, sys: 140 ms, total: 334 ms
Wall time: 313 ms
# Puerto Rico / NE-Caribbean window, nudged west to capture the full rainfall max
region = storm_total.sel(lat=slice(16.0, 20.0), lon=slice(-70.0, -62.0))

# Discrete precip colormap (NCL precip3_16lev), 0–600 mm
_rgb255 = [
    (255,255,255), (214,226,255), (181,201,255), (142,178,255),
    (127,150,255), (114,133,248), ( 99,112,248), (  0,158, 30),
    ( 60,188, 61), (179,209,110), (185,249,110), (255,249, 19),
    (255,163,  9), (229,  0,  0), (189,  0, 31), (165,  0, 33),
]
cmap_pr = ListedColormap(np.array(_rgb255) / 255, name="precip3_16lev")
levels  = np.arange(0, 601, 40)        # 0–600 mm (16 boundaries)
norm    = BoundaryNorm(levels, ncolors=cmap_pr.N, extend="max")

proj  = ccrs.PlateCarree()
trans = ccrs.PlateCarree()

fig, ax = plt.subplots(figsize=(9, 7), subplot_kw={"projection": proj},
                       constrained_layout=True)

im = ax.pcolormesh(
    region.lon, region.lat, region.values,
    transform=trans, cmap=cmap_pr, norm=norm, shading="auto",
)
ax.add_feature(cfeature.COASTLINE.with_scale("10m"), lw=0.7)
ax.add_feature(cfeature.BORDERS.with_scale("10m"),  lw=0.5)
ax.set_extent([-69.5, -64.5, 17.0, 19.3], crs=trans)

gl = ax.gridlines(draw_labels=True, lw=0.3, color="gray", alpha=0.4)
gl.top_labels = gl.right_labels = False

cbar = fig.colorbar(im, ax=ax, shrink=0.85, extend="max", ticks=levels[::2],
                    label="Accumulated rainfall (mm)")
ax.set_title("Hurricane Maria rainfall, 19–21 Sep 2017\nMPAS-A regridded (MAAG, d010077)",
             fontsize=12)
plt.show()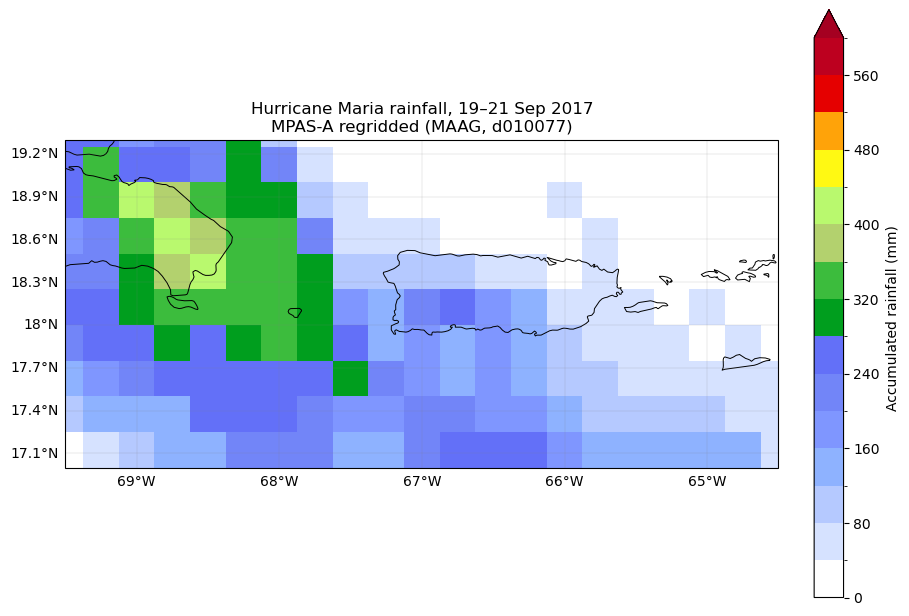
Summary
We accessed the MAAG Hurricane Maria (2017) MPAS-A simulation through GDEX’s
kerchunk reference layer, computed the 19–21 September storm-total rainfall as
rainc + rainnc differenced across the window, and mapped it over Puerto Rico —
a scaled-down version of Fig. 3a of Núñez Ocasio et al. (2026). The rainfall
maximum sits just west of the island, reflecting the simulation’s documented
slight westward bias in Maria’s track.
- Núñez Ocasio, K. M., Dougherty, E. M., Xue, L., Moon, Z. L., Ruiz Núñez, A., Morrison, M., Quagraine, K. T., Mu, Y., Martinez, C., Narinesingh, V., Cavazos, T., Rios, G., Bacmeister, J., Amador, J. A., Herrera, D. A., He, C., Maloney, E. D., Rasmussen, K., Reed, K. A., … Anderson, T. G. (2026). Advancing Weather and Climate Science in Mesoamerica and the Caribbean: A Novel Regional Multiweek Convection-Permitting Simulation. Bulletin of the American Meteorological Society, 107(4), E836–E852. 10.1175/bams-d-25-0023.1
- Núñez Ocasio, K. M., & Dougherty, E. M. (2024). The Effect of Pseudo‐Global Warming on the Weather‐Climate System of Africa in a Convection‐Permitting Model. Geophysical Research Letters, 51(24). 10.1029/2024gl112341