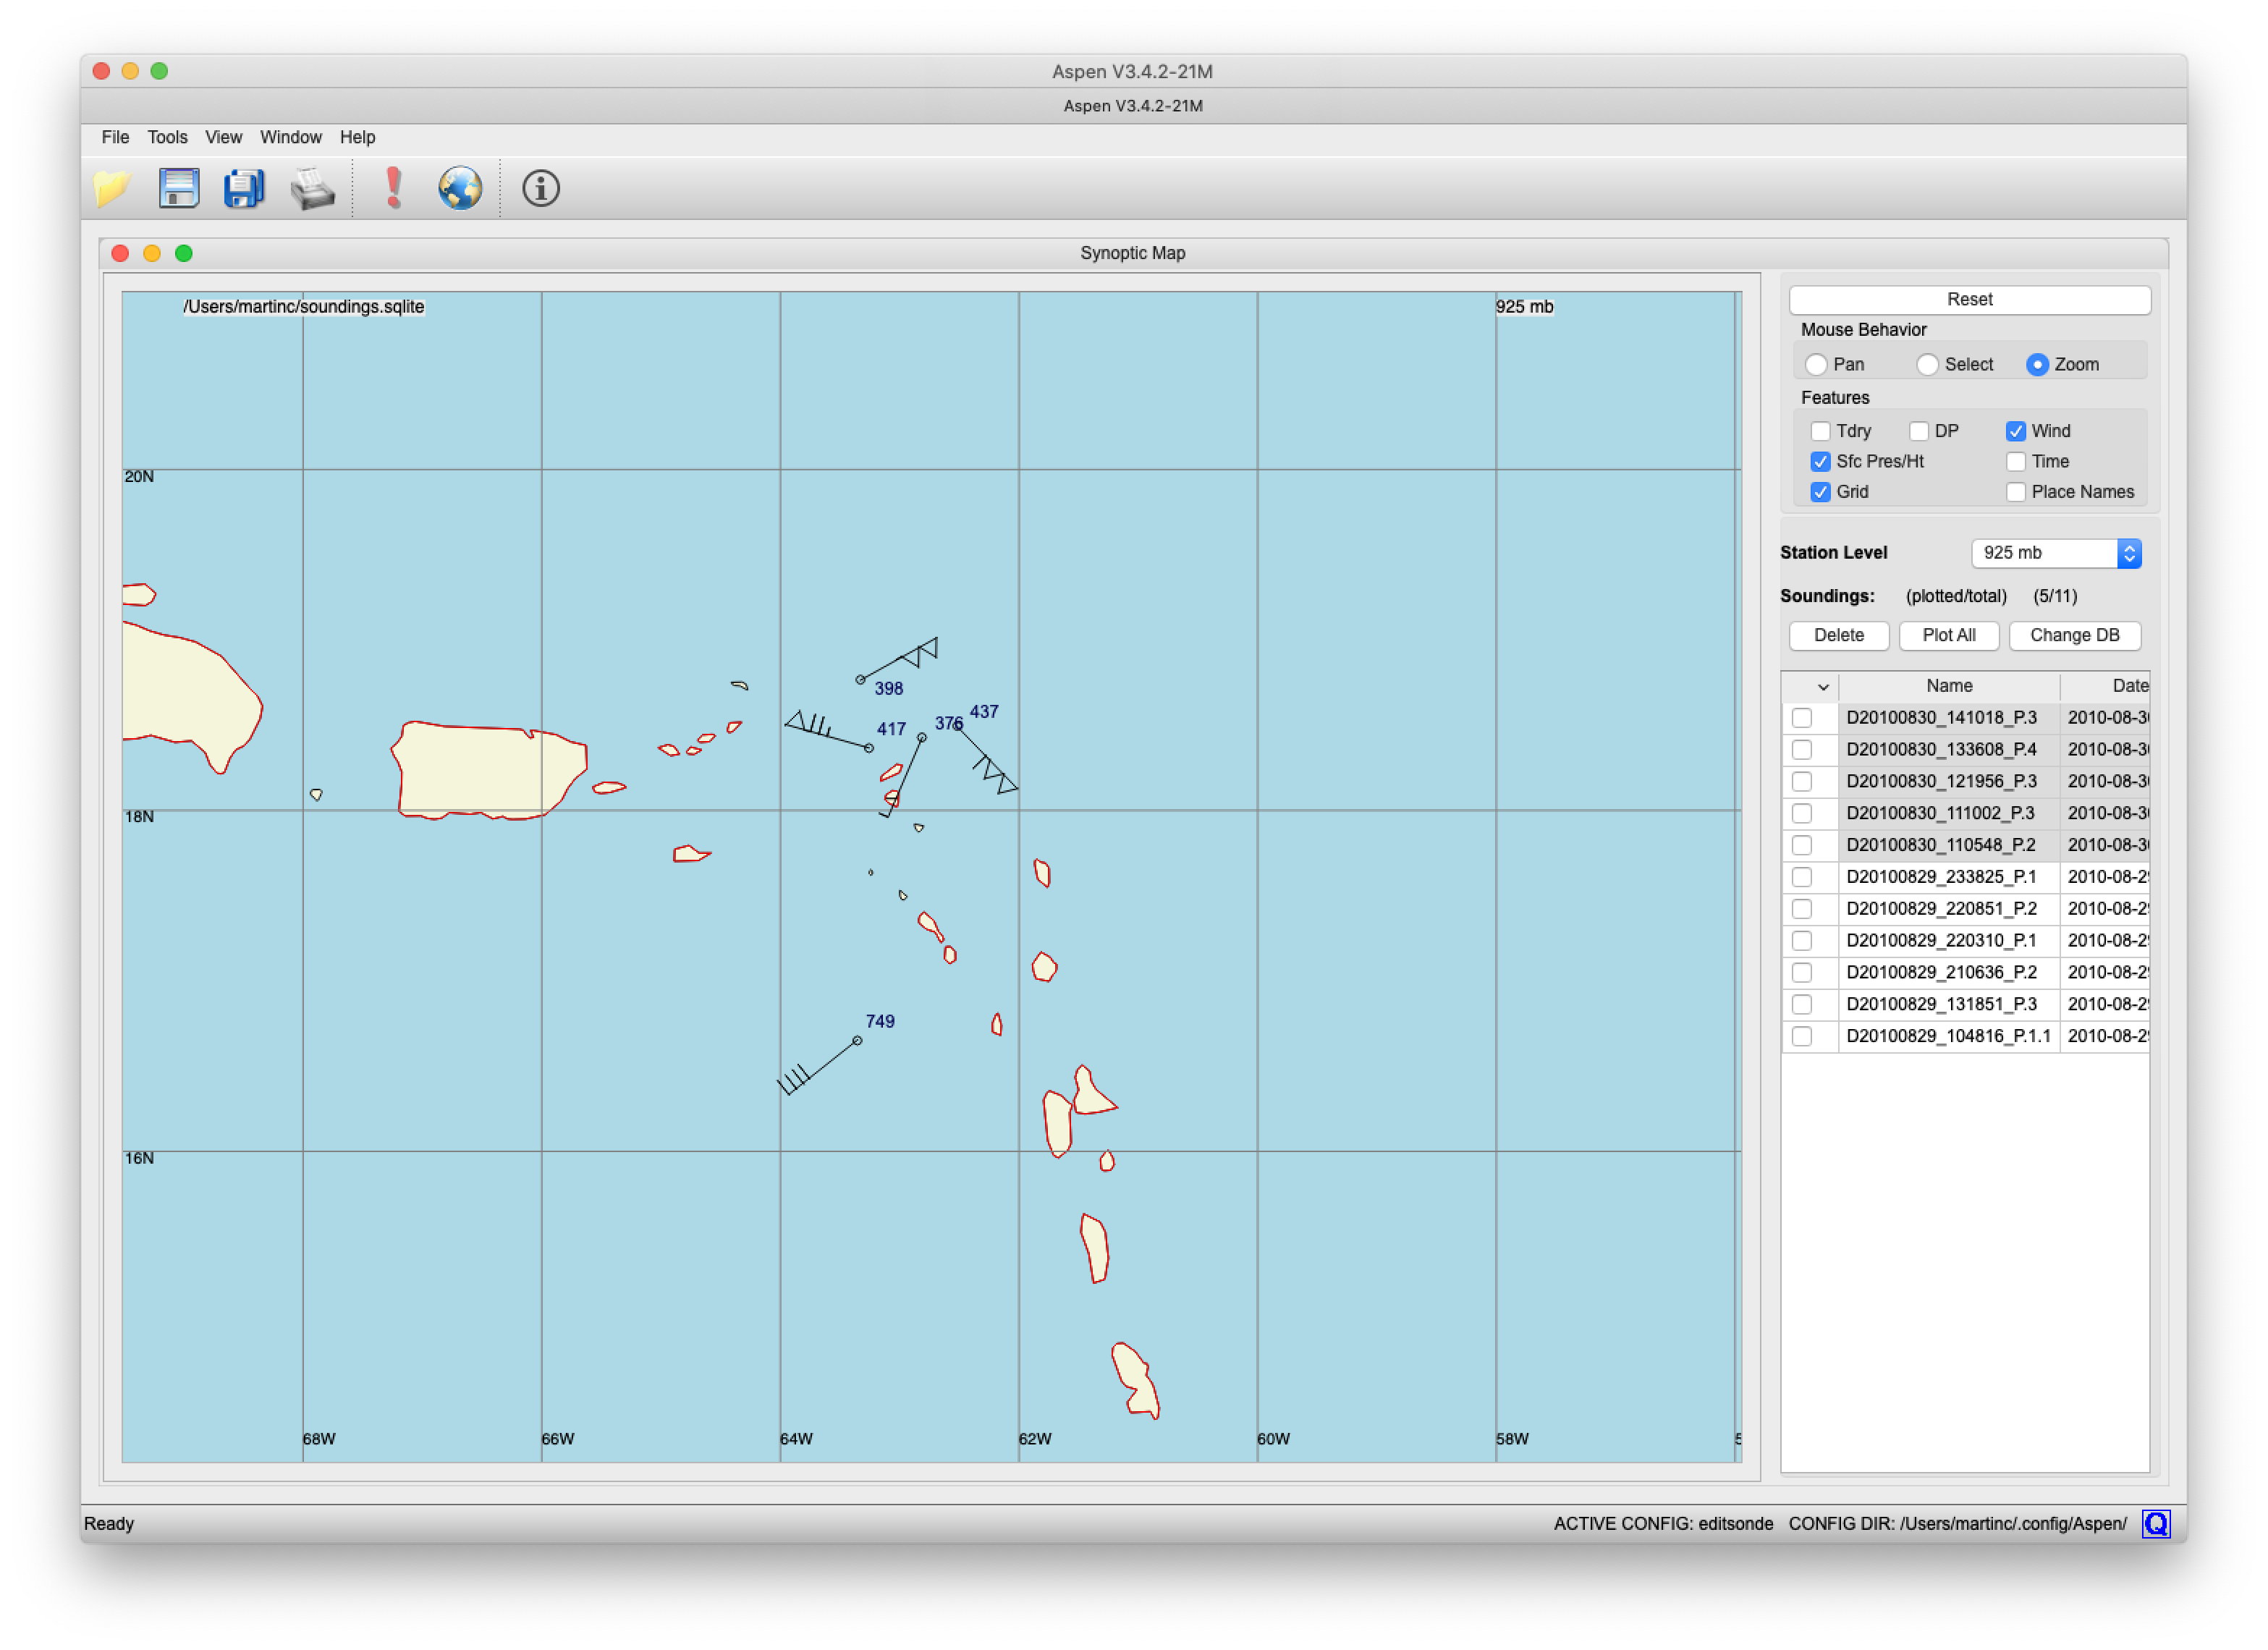
The Synoptic Map provides a plan view of station models for soundings, at selected levels. These are overlaid on a geographic basemap.
If Aspen has been reinstalled you may be prompted to configure the geographic database location. See Configuration.
Databases and Configuration
Sounding Database
Every time Aspen processes a sounding, Q/C data are written to the sounding database. The Synoptic Map uses this as a data source for plotting the map, and the individual soundings are identified in the database by the source data file name. The database is created the first time that you run Aspen.
This is a simple SQlite3 database, which is a single file. You can maintain separate databases as needed, simply by selecting a different file name and/or location. You can even use the SQlite3 database for your own applications, if desired.
Soundings may be removed from the database using the Synoptic Map sounding browser. If a sounding is processed multiple times in Aspen, the most recent data replaces existing values in the database.
Geographical Database
The shape data for the geographical base map is also stored in an SQlite3 database. This geographical database is distributed with Aspen. Because it is difficult for a program to easily determine its install location on multiple operating systems, you must configure Aspen to locate this database.
Configuration
You will be prompted to enter the database locations when the Synoptic Map is opened for the first time. The default location can be used for the sounding database.
The explicit location of the geographical database must be provided. This will be a .sqlite file in the Geodata directory below where Aspen is installed, e.g.:
username/AspenV3.4.1/Geodata/ne1to50m.sqlite
The Aspen installation location may vary, but it is typically in the user’s home directory.
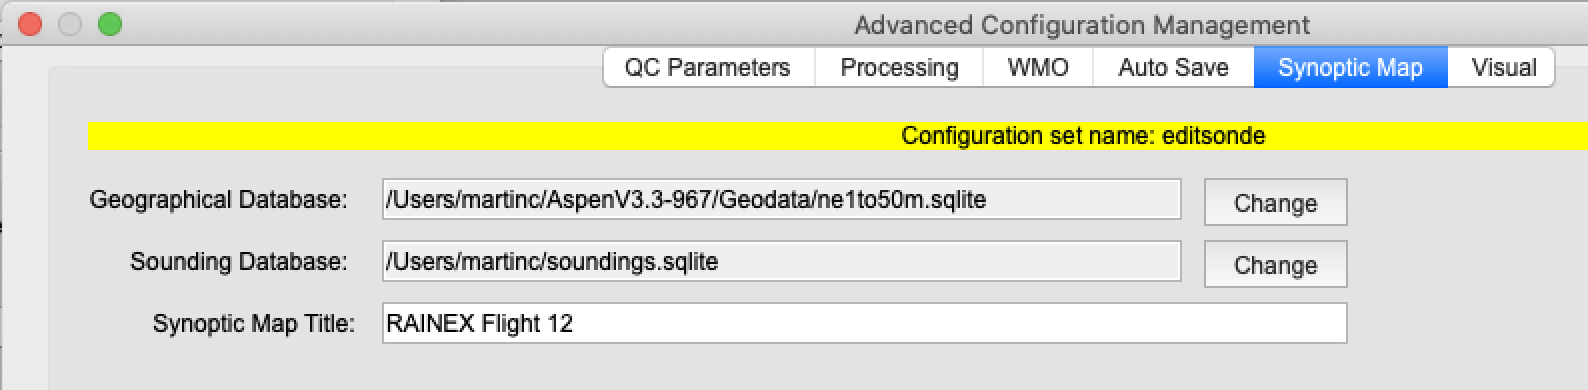
The database file locations can also be changed from the Synoptic Map tab of the standard Aspen configuration screen:
Usage
Open the Synoptic Map from the Tools menu, or by clicking the World button:
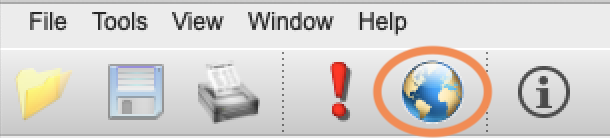
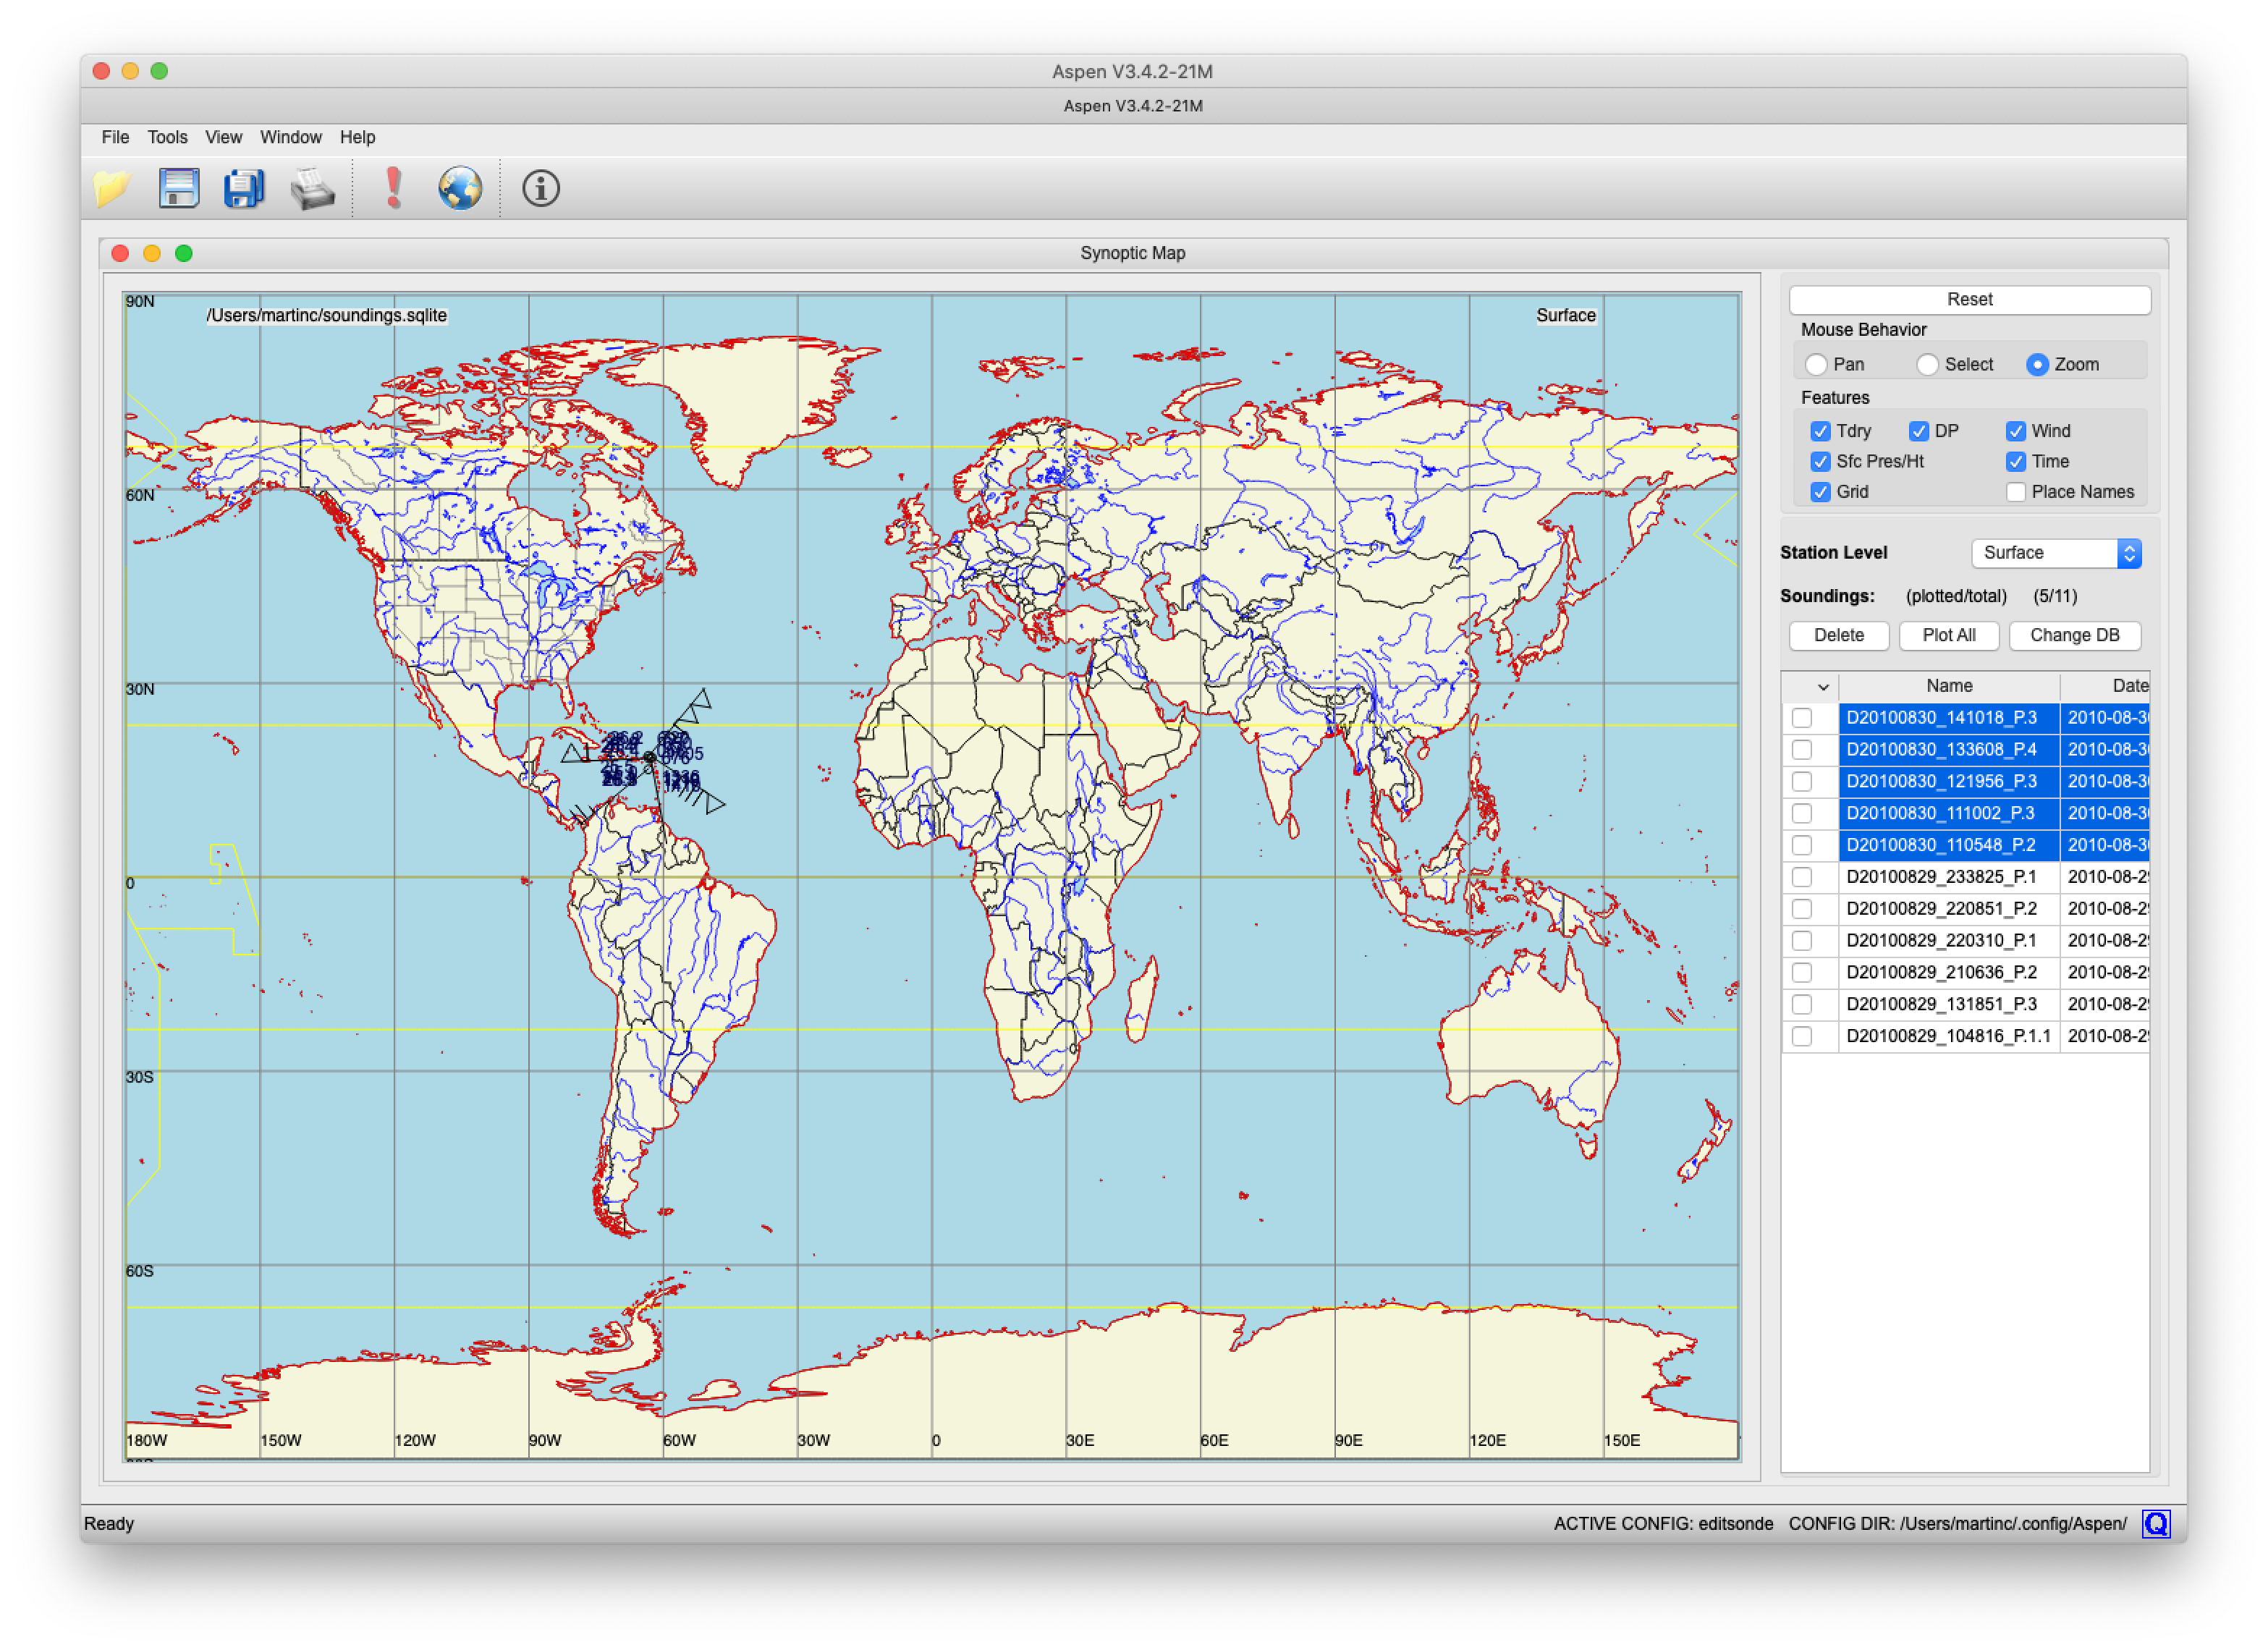
A new window will open, displaying a world map. A control panel and database browser are shown on the right side.
Select soundings in the database browser to display them on the map.
Map Navigation
- Left-click and drag to zoom into a region.
- Right-click to revert one zoom step.
- Use the radio-buttons at the top of the control panel to select the map mouse behavior. You can also just double click on the map to cycle through these options.
- Use the Station Level drop-down to select which sounding level to display. Standard pressure levels and a few diagnosed levels are available.
Station Model
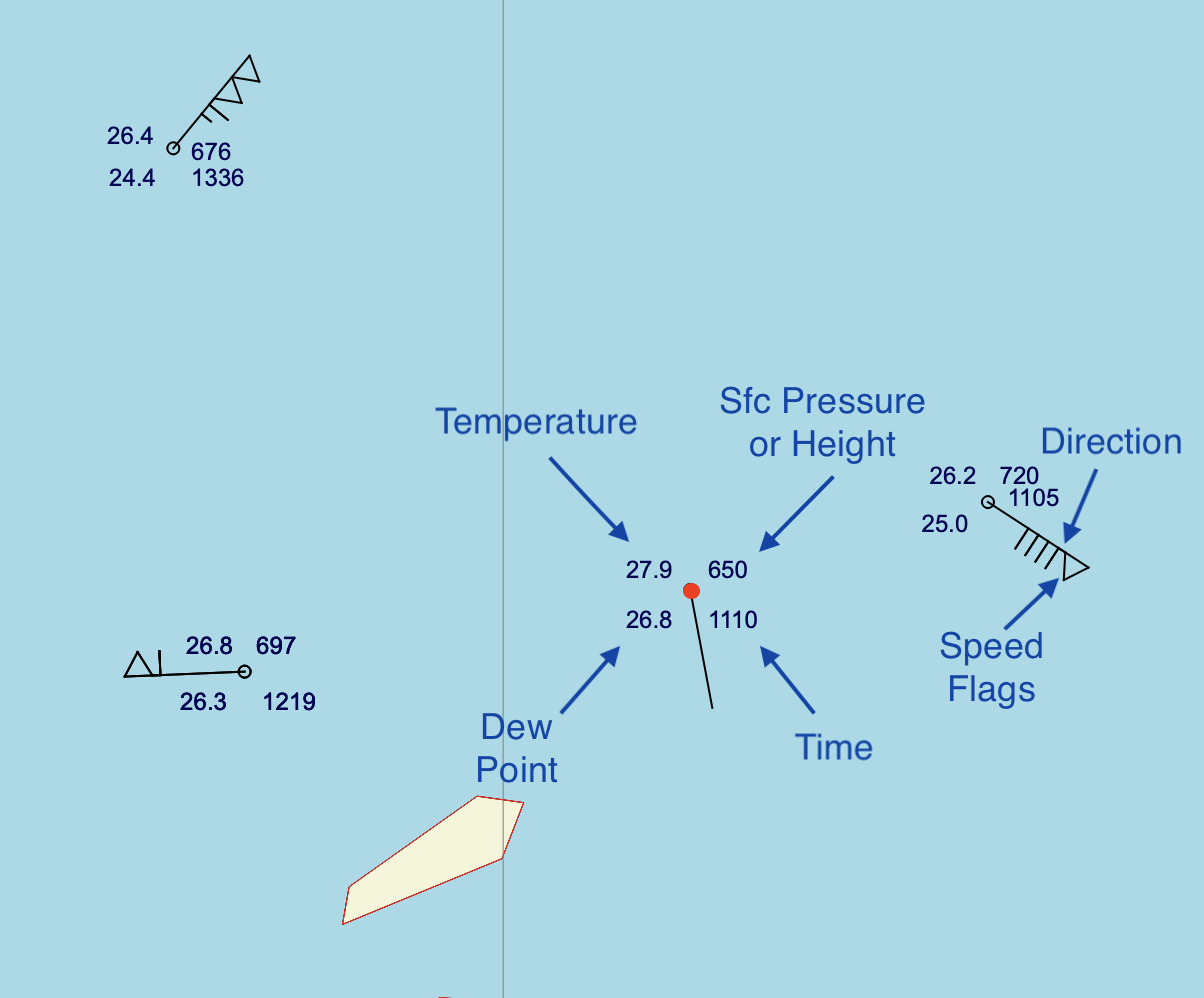
Each observation for the selected level is depicted by a standard meteorological station model. If there is no data for the sounding at that particular level, a single small circle is displayed.
The station model elements are selected on the control panel. They are:
- Temperature (degrees C).
- Dew point temperature (degrees C).
- Pressure if at the surface (10*mb); altitude if above the surface (msl).
- Time of the sounding (UTC).
- Wind direction (the barb points into the wind).
- Wind speed, determined by summing the flags:
- half line segment: 5 kts.
- full line segment: 10 kts.
- triangle: 50 kts.
When you hover over the center of the station model, the circle will turn red and identifying information will pop up. Click right to select reprocessing of the sounding, or to remove it from the map.
Saving Images
Map images may be saved when the Synoptic Map window is open. Select the desired save option from the main Aspen File menu:
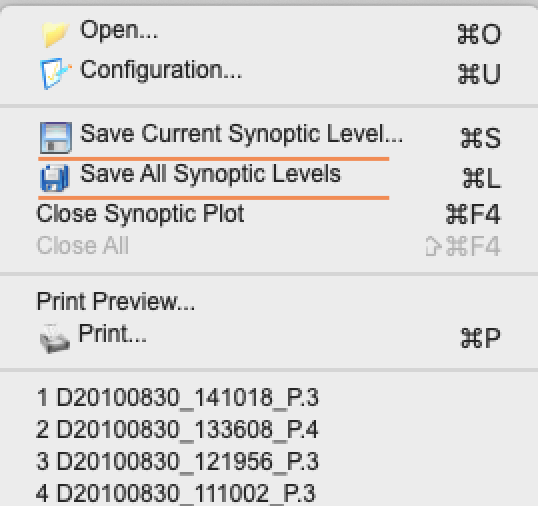
Saving the current synoptic level will generate one image. Saving all synoptic levels will generate a set of images, one for each station level available.
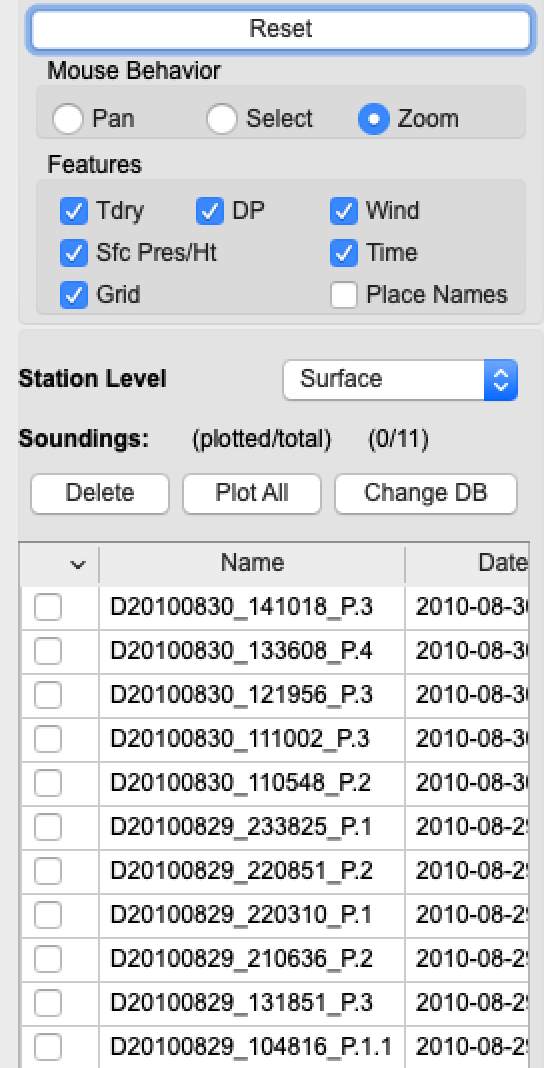
Control Panel
The control panel has display options at the top, and a sounding browser on the bottom. Note that different sounding information may be displayed by scrolling the browser window left/right. Mouse behavior, station model features, and displayed levels are selected from the options.
The station model is generally too busy when all parameters are selected for display. De-clutter the display unchecking the ones that you don’t really need.
-
Displaying a sounding: Click on the sounding name to (de)select it.
-
Deleting a sounding: Use the check boxes and the Delete button to permanently remove a sounding from the database. It can be added back to the database by reprocessing the sounding file with Aspen.
-
Changing the database: Use the Change DB button.