Each tab displays identifying information that describes the sounding. The details are extracted from various fields within the raw data file. For graphical displays, this information is printed as text on the graph. For other tabs, a yellow bar at the top of the tab contains the identification.
Main Tab
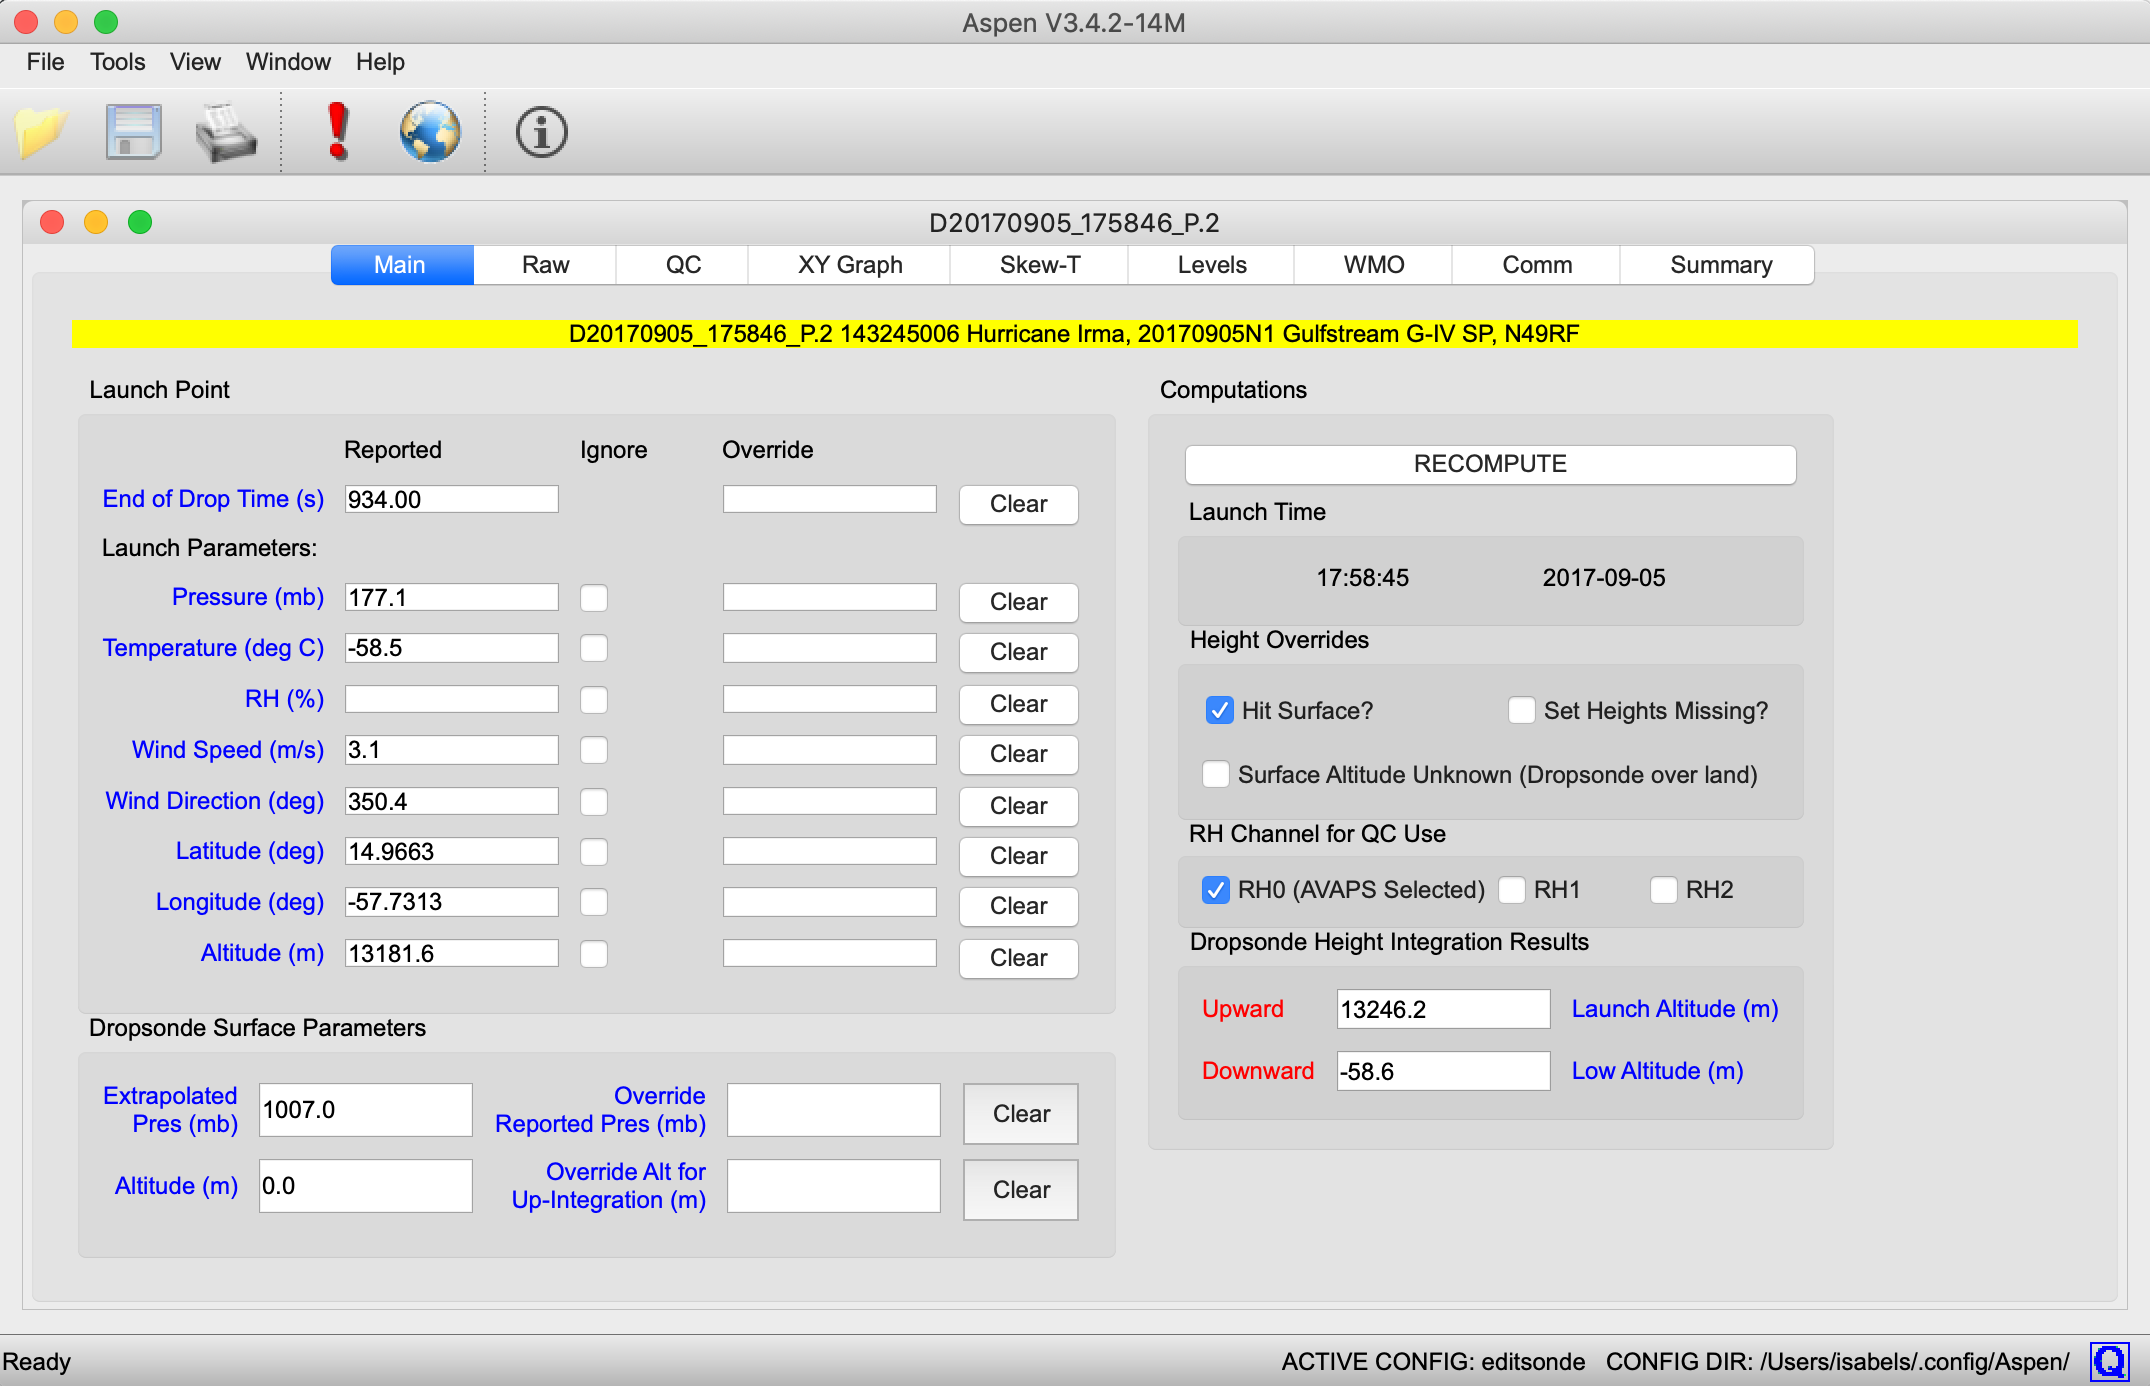
The Main tab is used to view and modify certain characteristics of the sounding, including launch observations, height integration results, and end of drop time. See the Post-Processing Adjustment section for directions on modifying information in the Main tab.
Be sure to press “RECOMPUTE” after changing items on the Main tab.
Raw Tab
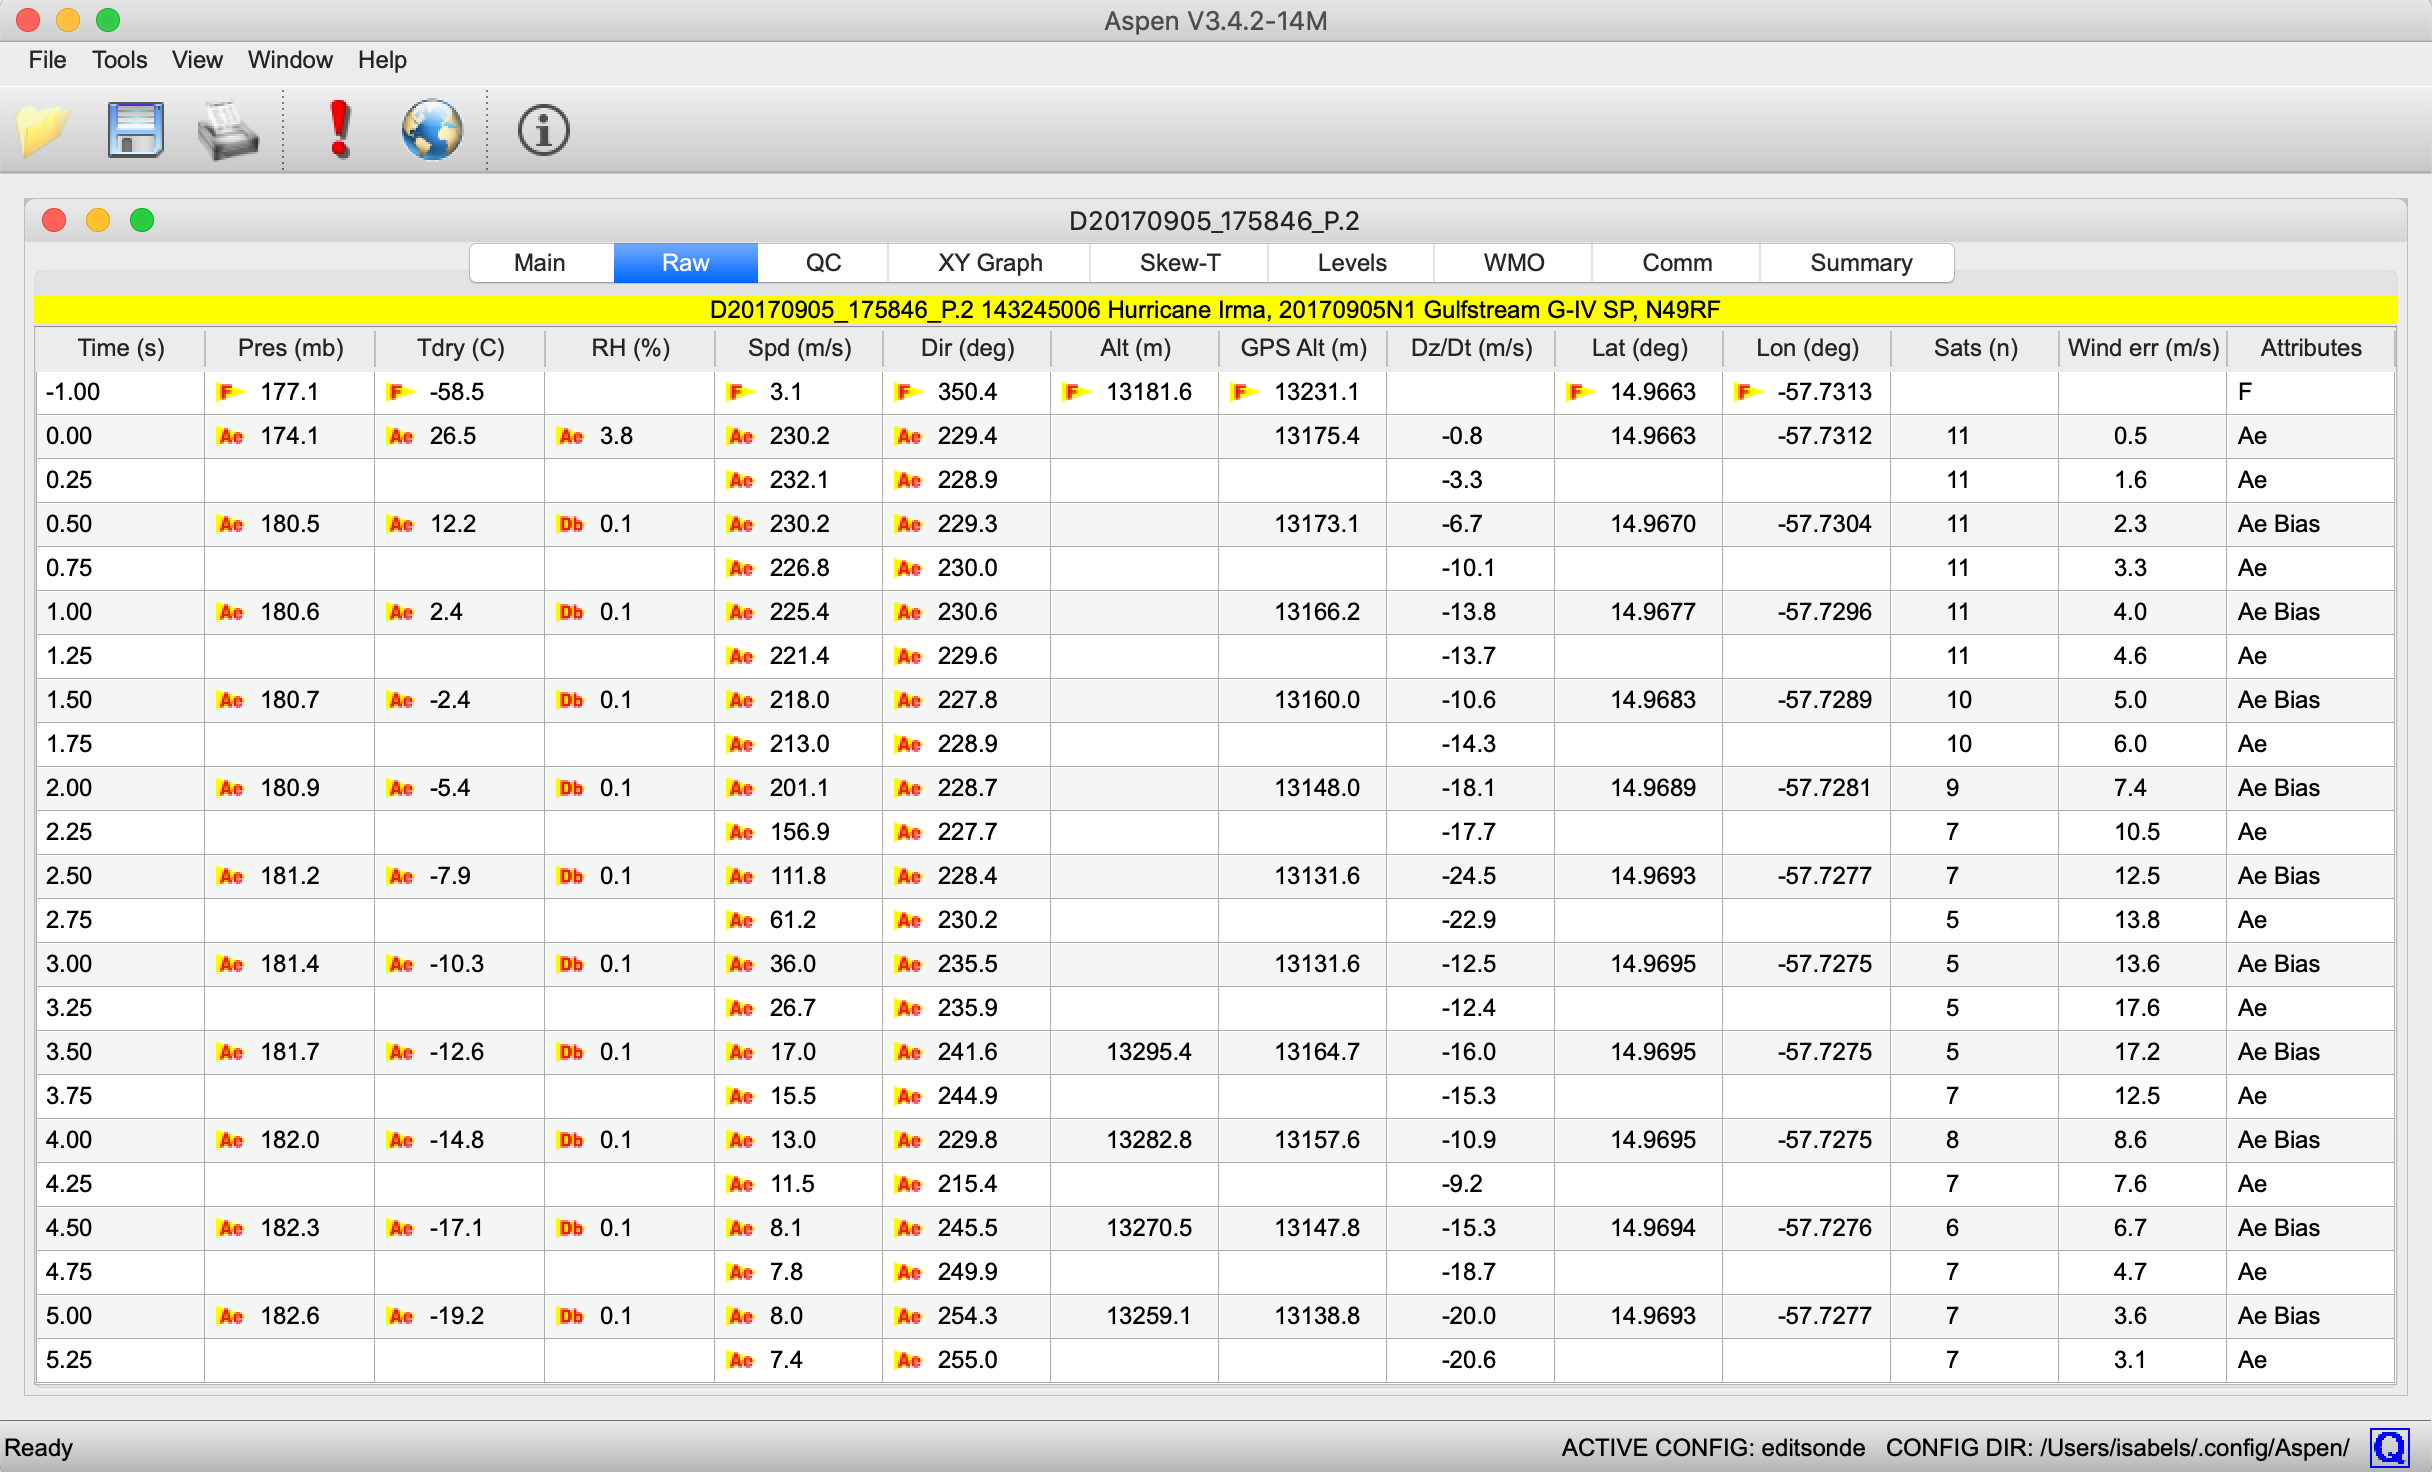
This tab provides the information in the input file in scrollable tabular form. Data values are listed in time order from the beginning of the sounding, with the launch observation shown in the first data line with a time of -1s.
Data from the raw tab can be printed or saved to multiple file formats (see Output File Formats section).
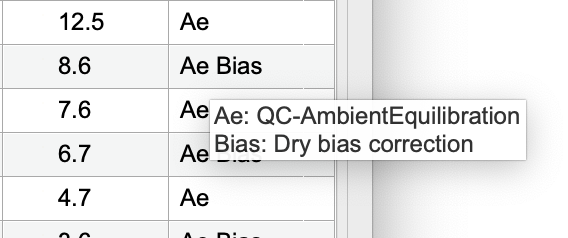
Data values that will be removed during Aspen processing are noted with attribute flags in the Raw tab, as shown above. The flags note which quality control procedure will remove the data during processing. The Attributes column, on the right side of the Raw tab, lists the attribute flags that appear in each data line. Mousing over the attribute abbreviations in this column will show the full names of the quality control procedures.
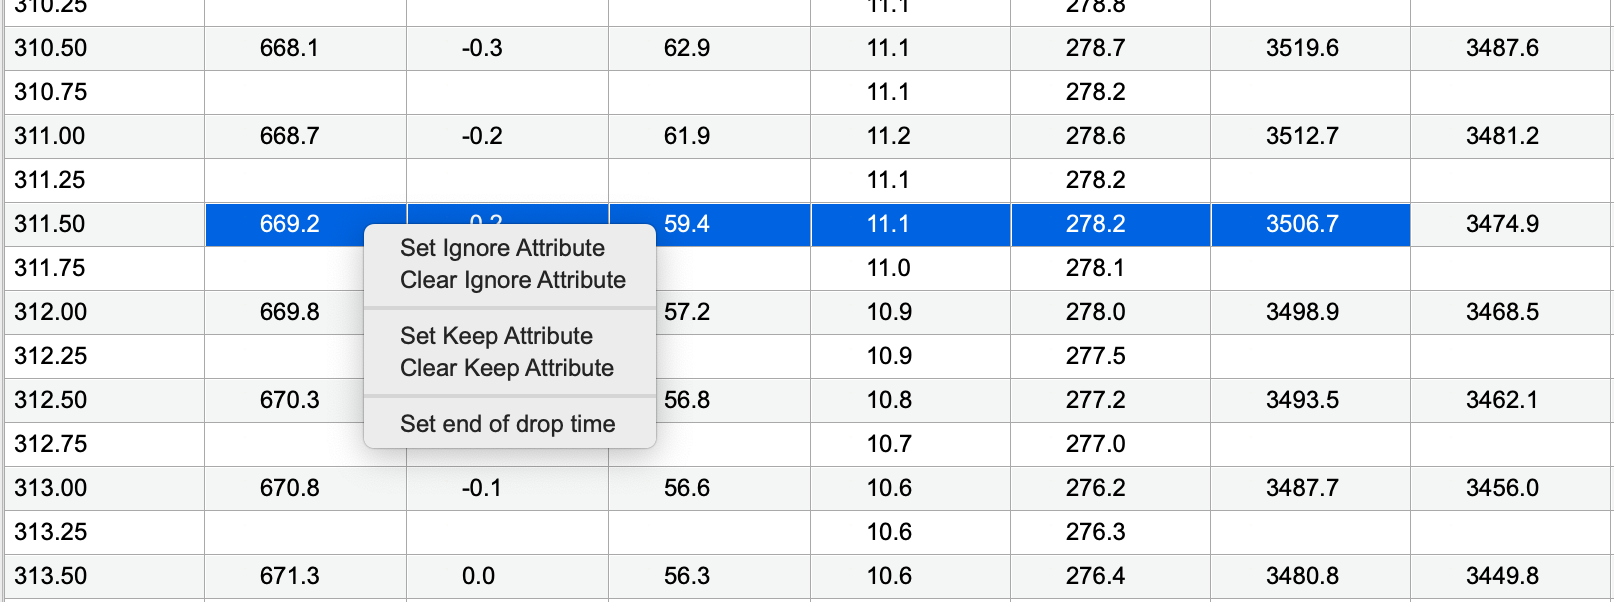
From the Raw tab it is possible to set processing features on selected data points. Any data cell can be set to either ignore or keep during processing. Ignoring a data point removes it from the QC data, and can be used to remove bad points that don’t get removed by Aspen quality control processing. Keeping a data point will ensure it remains in the QC data, and can be used to override Aspen processing when it removes points that should be kept. Keep or ignore data points by selecting the cells you wish to keep/ignore, then right click. In the menu, you can then select to set the keep or ignore attributes or to clear those attributes. You will need to press the recompute button after setting or clearing these attributes.
To select an entire column, click the column header.
It is also possible to set end of drop time from the raw tab by selecting the row with the desired end of drop time, then right click to access the menu item to set end of drop time. End of drop time can also be set in the box on the Main tab, and either process will have the same result.
Use Ctrl+E (Cmd+E on Mac) to jump to the bottom of the raw tab.
Data lines that come after a user-set end of drop time will appear deselected in the main tab.
Cells that have been selected as keep or ignore will show the respective attribute flag in the raw tab, and will be highlighted in blue. Launch parameters cannot be assigned keep or ignore attributes, but can instead be modified in the Main tab. Values in the time column cannot be selected because Aspen indexes data values by time. Additionally, values in the geopotential altitude, satellites, and wind error columns cannot be selected because these values are not processed by Aspen QC.
QC Tab
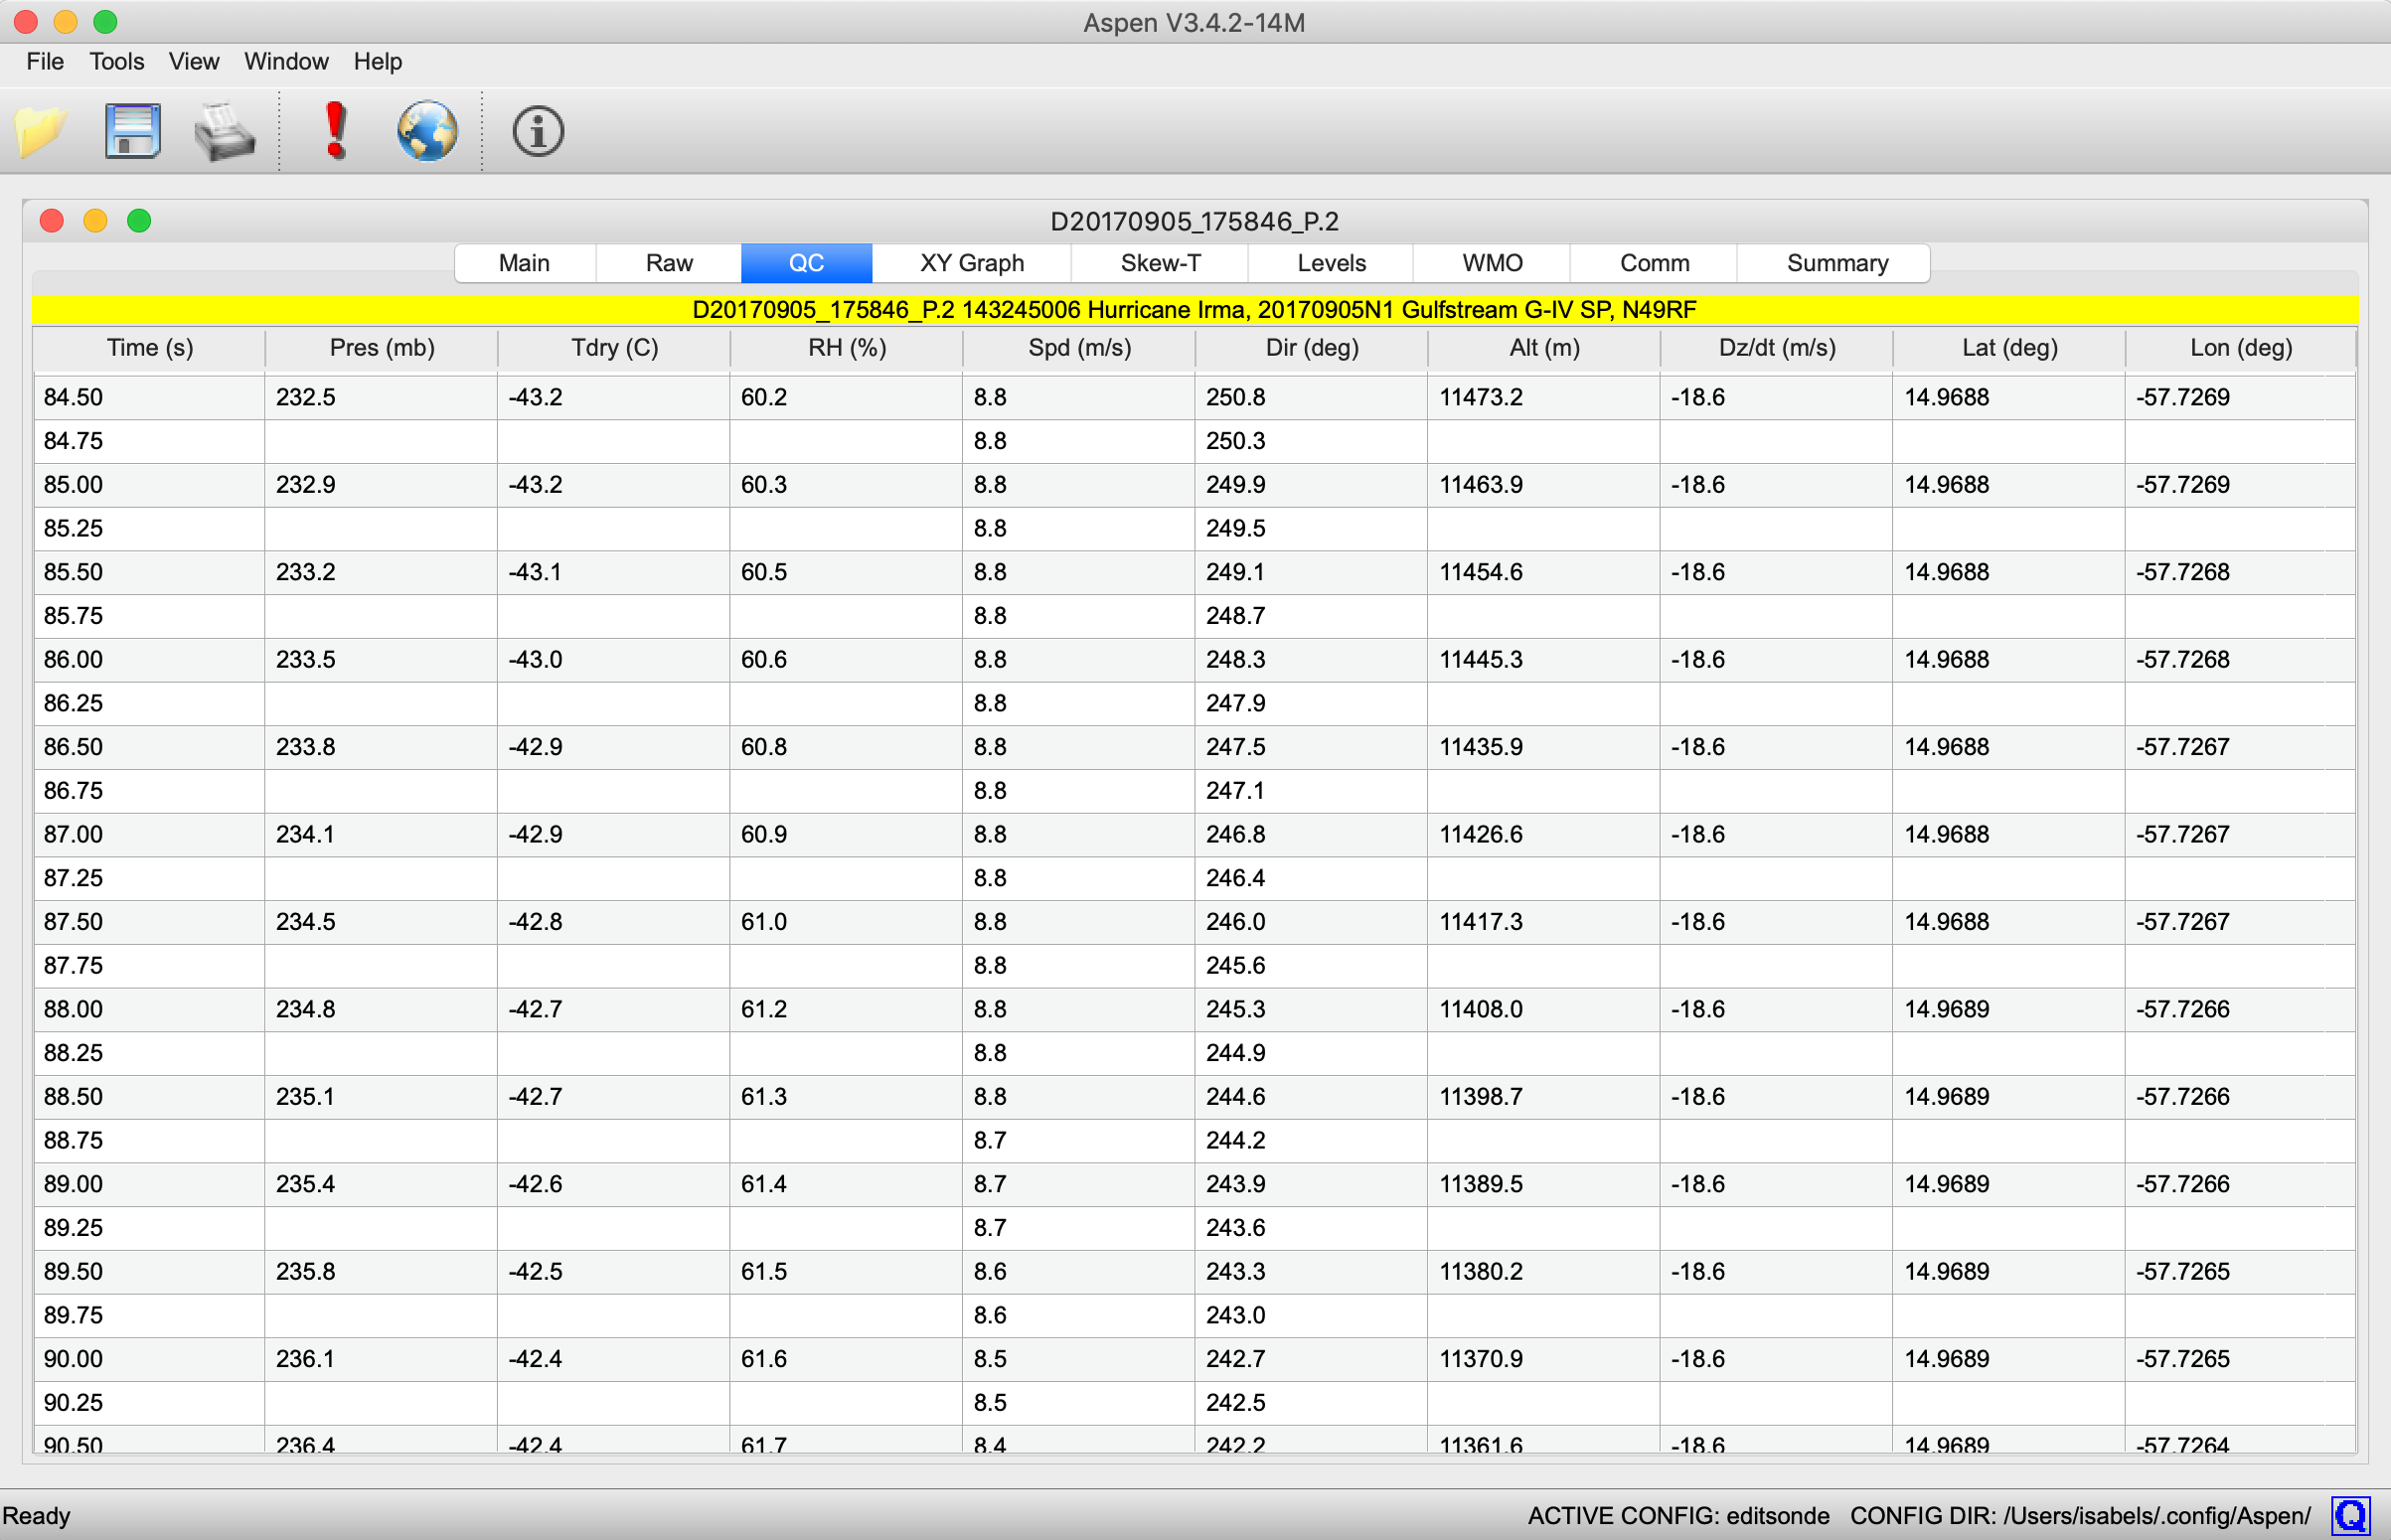
This tab provides the quality-controlled sounding data in scrollable tabular form. Data in this tab is the final Aspen product and is what will be written to output files. Data values are listed in time order, starting with the launch observation with a time of -1s. Empty cells indicate no data at that time.
Use Ctrl+E (Cmd+E on Mac) to jump to the bottom of the QC tab.
Data from the QC tab can be printed or saved to multiple file formats (see Output File Formats section).
XY Graph Tab
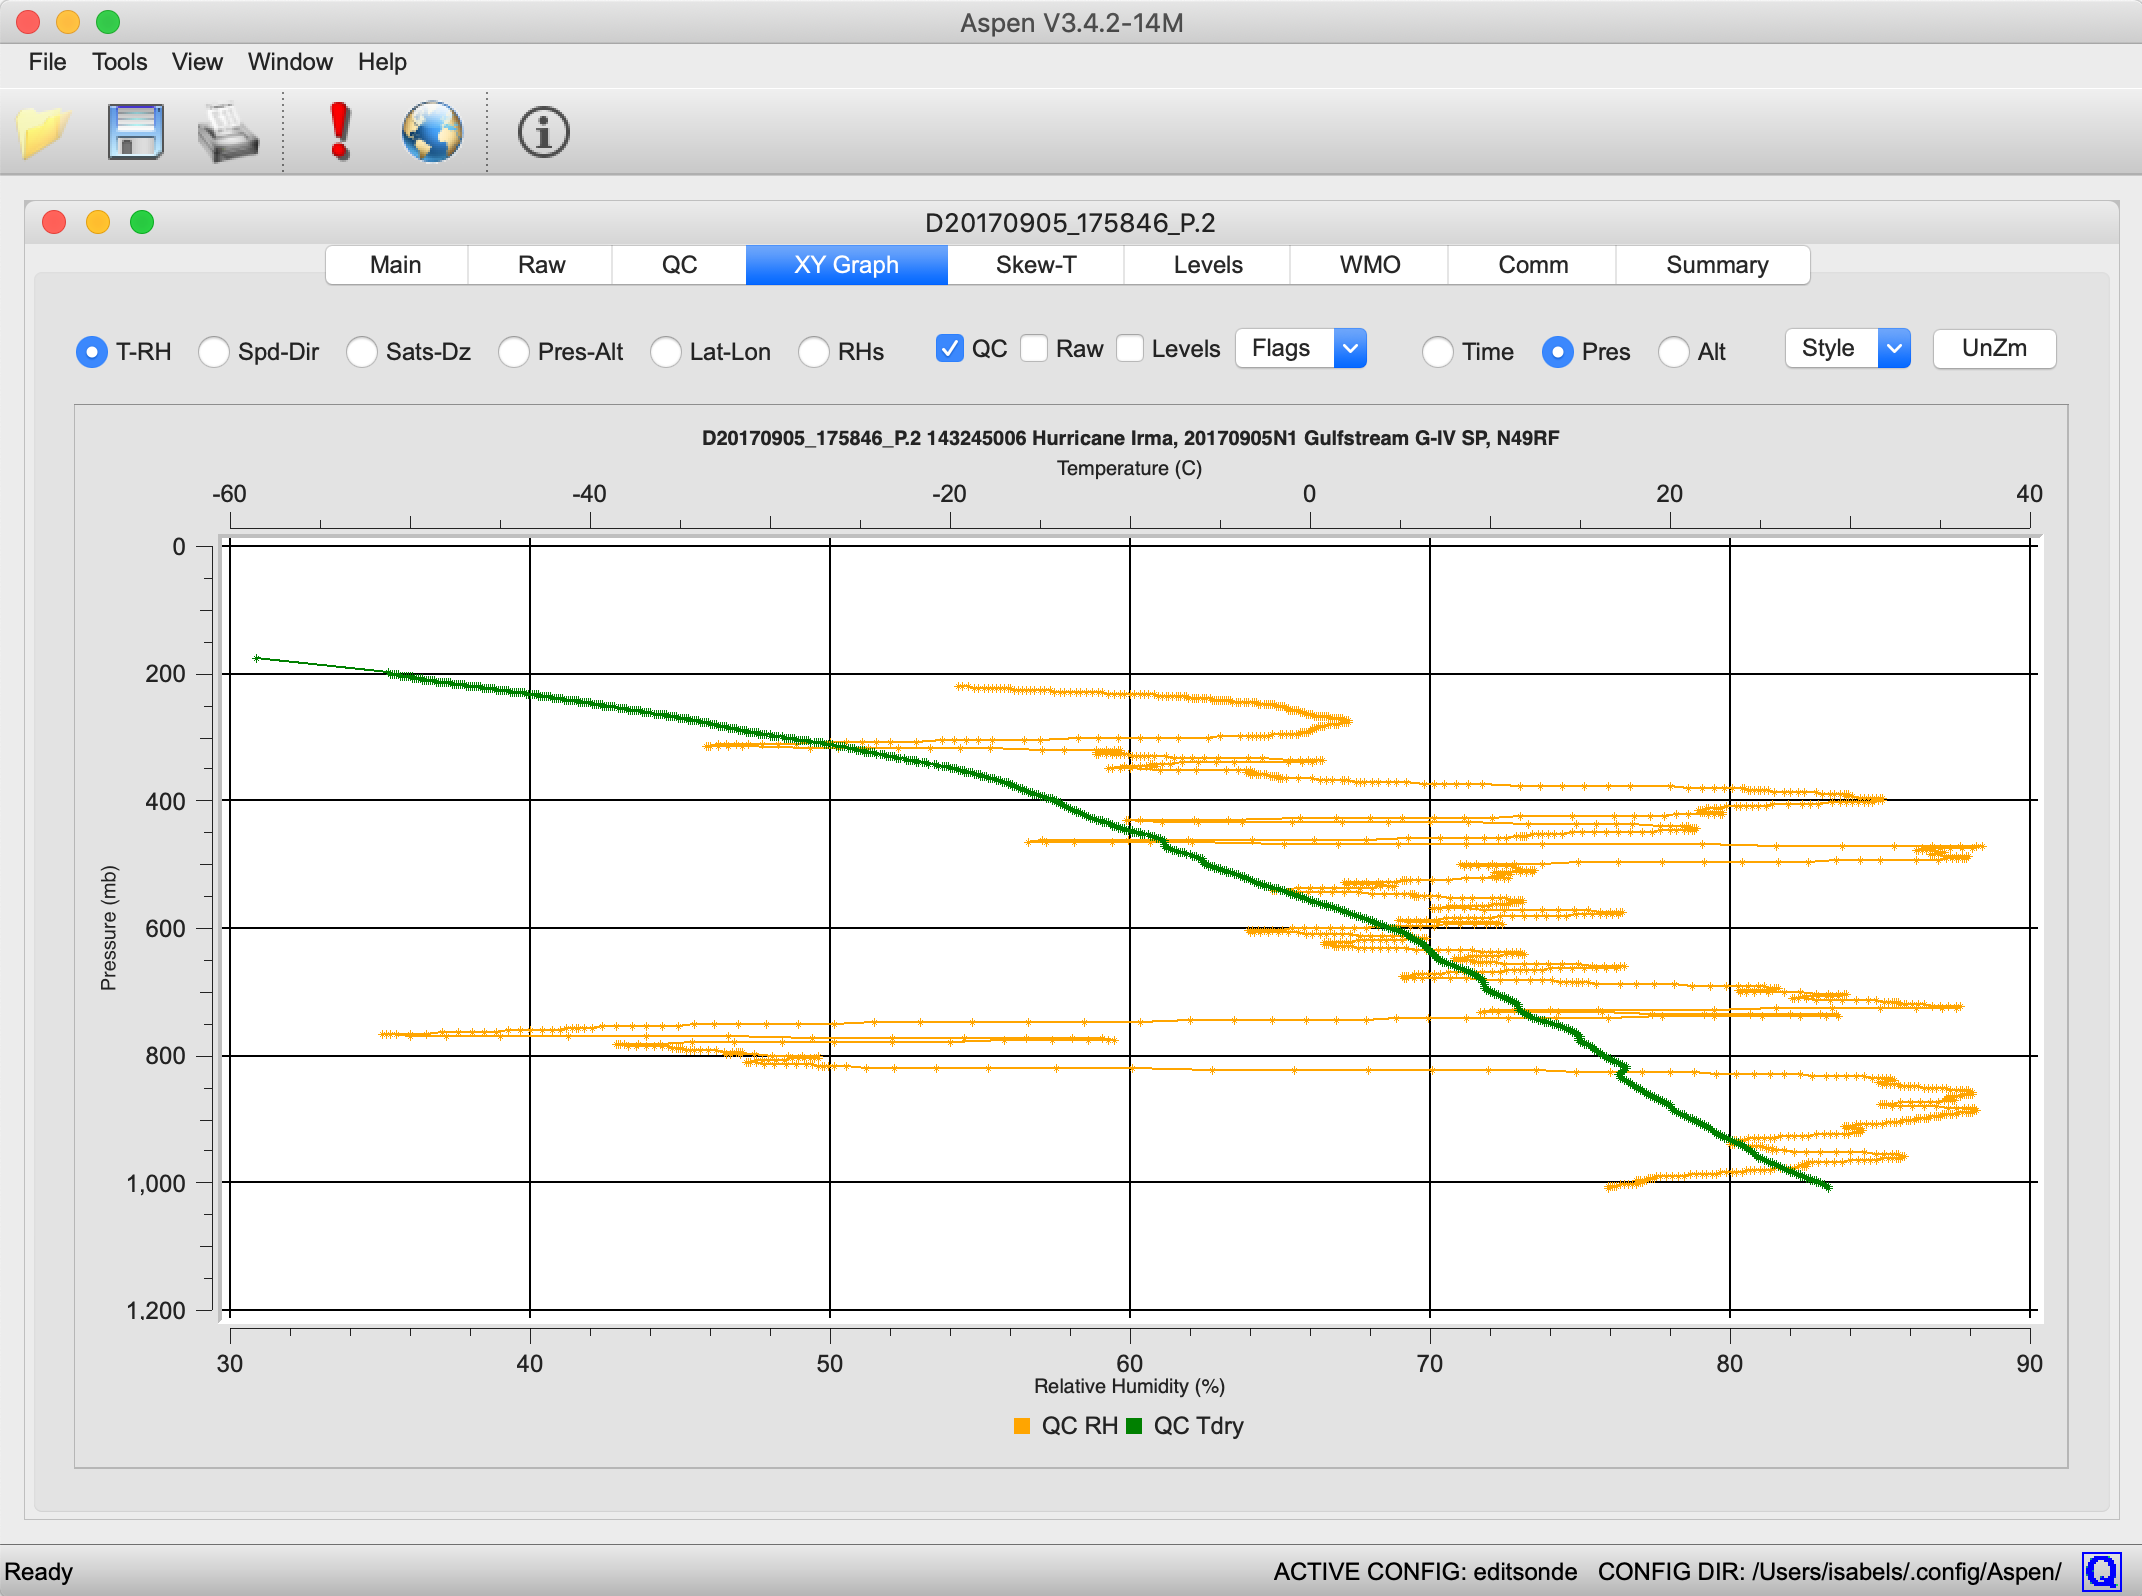
This tab provides numerous options for graphical display of the data. Above the graph are buttons and menus that can select which data to plot and how it is displayed. The options are as follows:
- Data series selection: The first 5 radio buttons select which data series to plot on the graph.
- T–RH: Selects temperature and relative humidity series.
- Speed-Dir: Selects wind speed and direction series.
- Sats–Dz: Selects number of satellites and ascent speed series.
- Pres-Alt: Selects pressure and altitude series.
- Lat-Lon: Selects latitude and longitude series.
- RHs: Selects RH1, RH2, and combined RH series (which appear in data from RD94 and older dropsondes).
-
Data processing selection: The QC, Raw, and Levels checkboxes select the dataset(s) to be displayed in the graph. Multiple datasets may be displayed at the same time. When levels are displayed, standard levels are displayed as triangles and other levels are displayed as circles.
-
Display of attribute flags: When raw data is displayed, attribute flags can be plotted over the data series. Using the drop-down menu flags can be added, either all flags or flags associated with specific data QC procedures.
-
Y axis selection: These buttons select the parameter displayed along the vertical axis. Keep in mind that in dropsonde data some lines have data but no pressure or altitude, so to display all the available data using time as the vertical axis is recommended. In addition, when the raw data is displayed using the pressure or altitude vertical axis, the display may be confusing due to noise in the raw pressure reading.
-
Style: This drop-down menu provides options for customizing the view of the graph: options to add a background grid for either X or Y axis, and whether to plot data points or to include lines between them.
- Zoom: To magnify (zoom) an area of the plot, left-click and drag to draw a rectangle around the area of interest. Release the left mouse button to zoom into the defined area. The UnZm button restores the graph to the full area display.
The contents of the XY graph can be saved as either PNG or JPG using the Save button in the Aspen toolbar. PNG provides better compression and much higher quality graphics presentation for the line drawings of Aspen, and is the preferred file format. The pixel dimensions of the saved graphic file can be specified in the configuration options.
Skew-T Tab
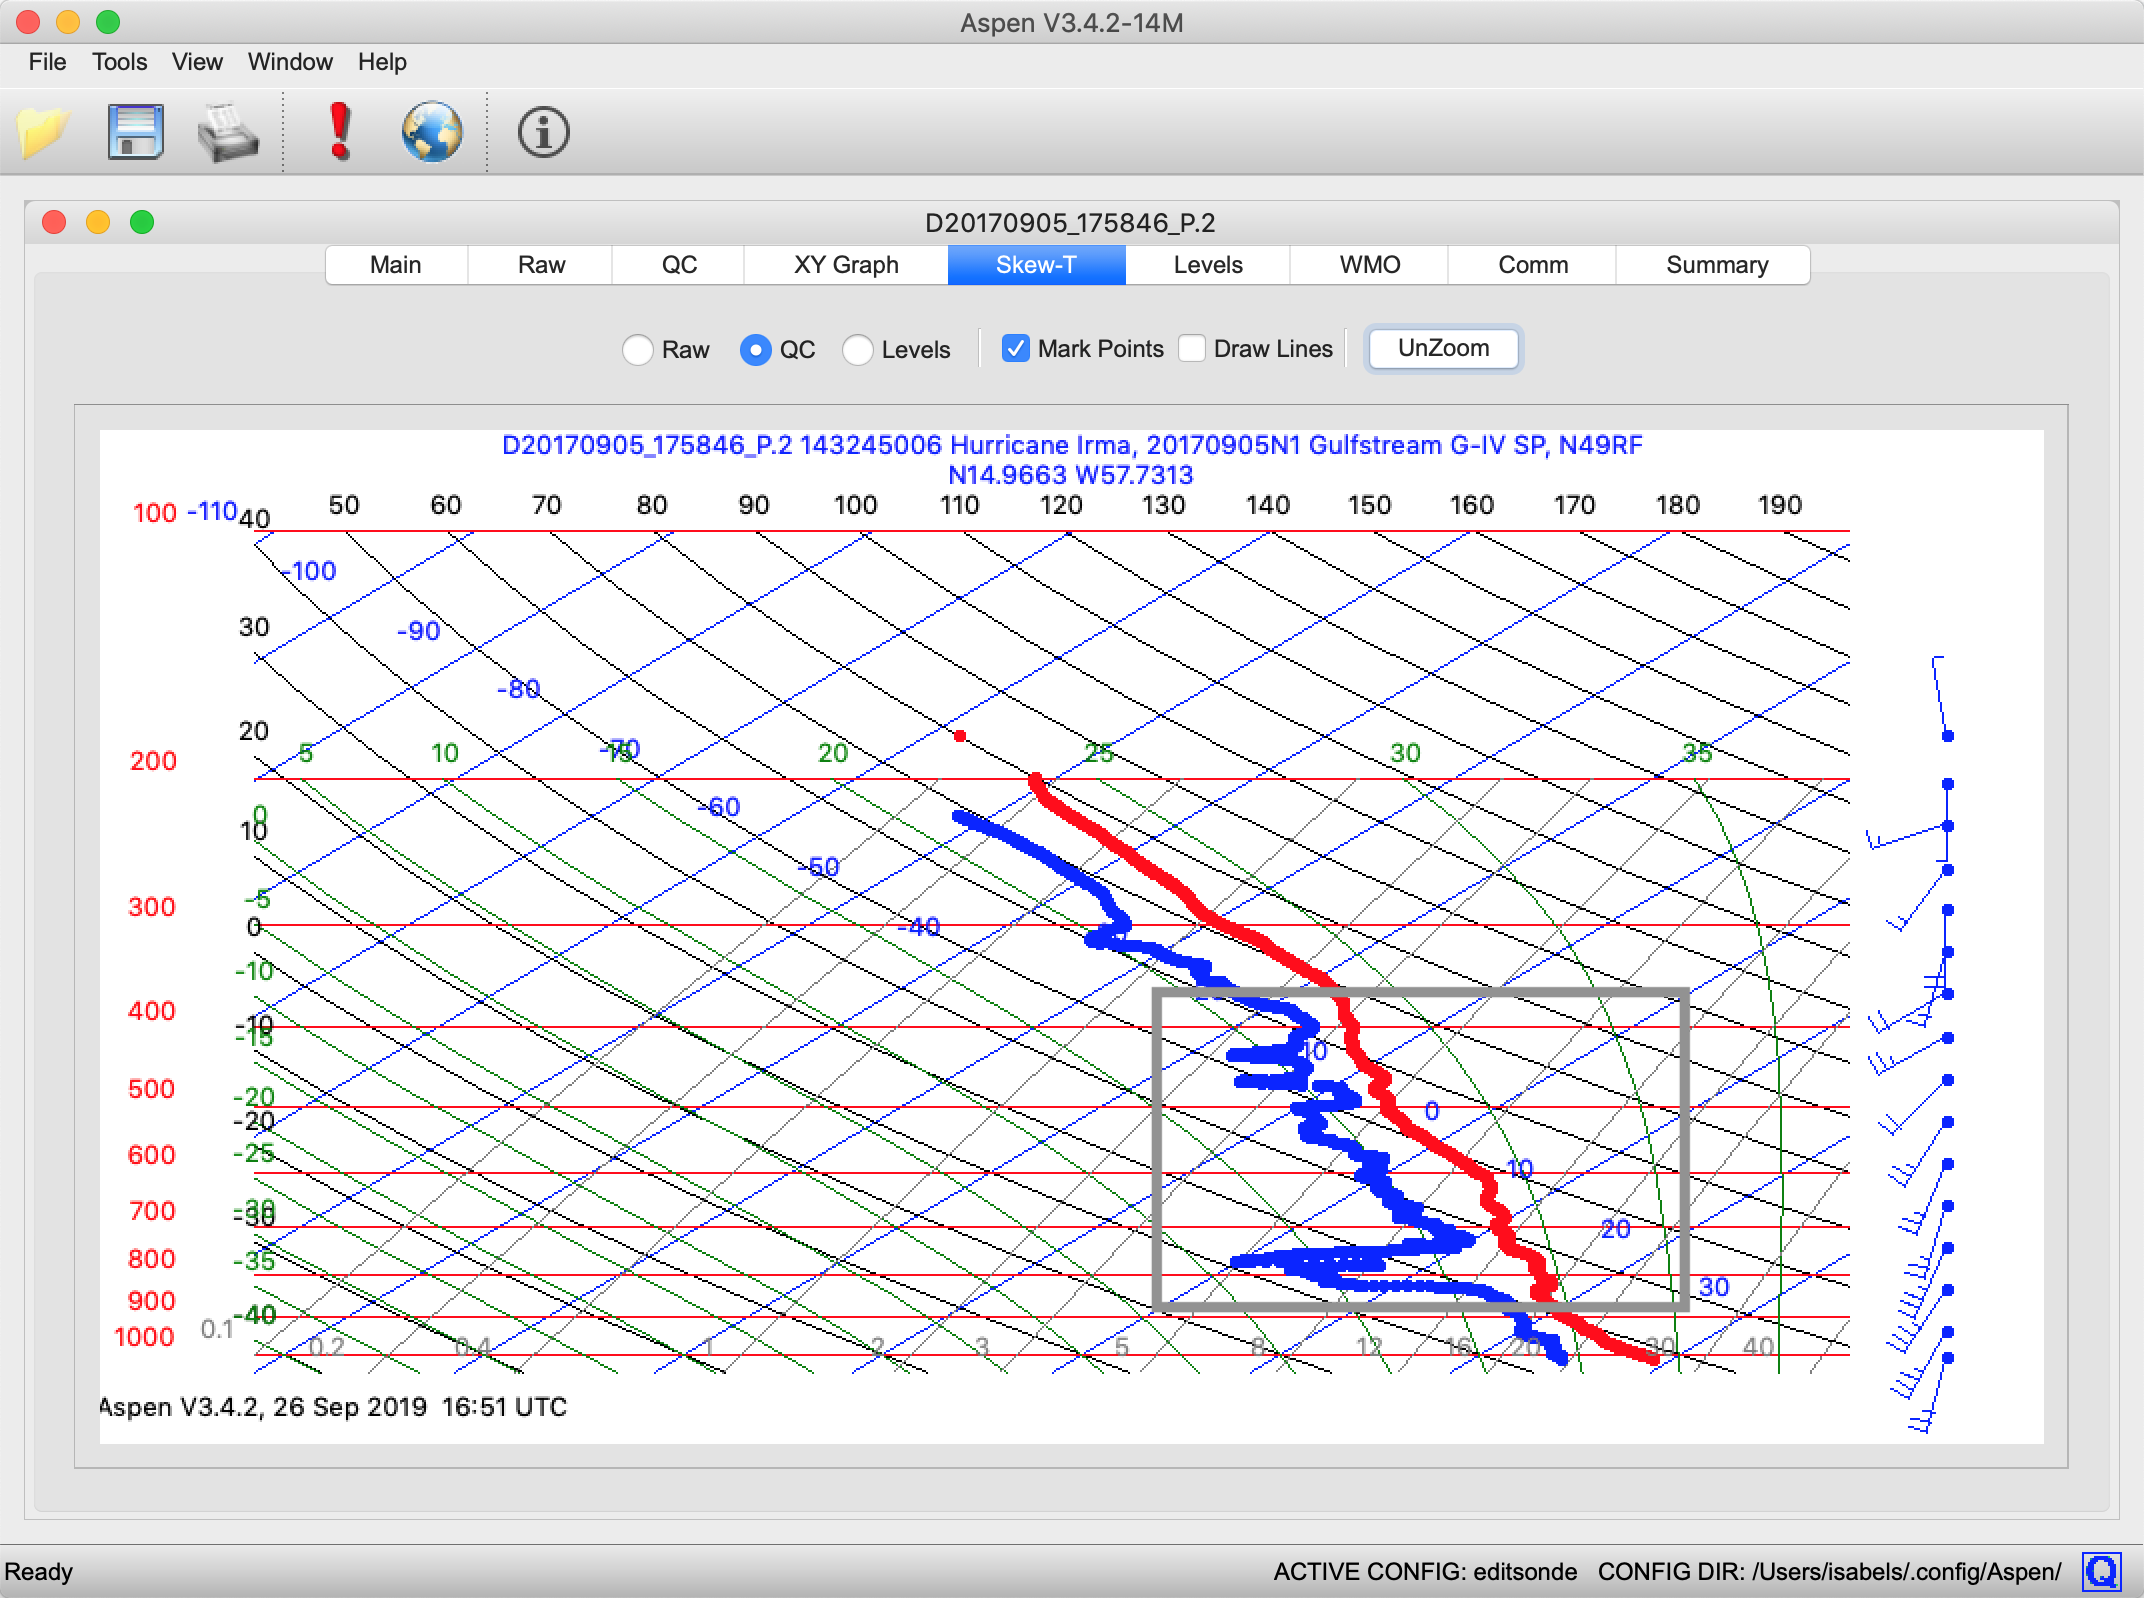
A standard skew-T log-P plot is accessed in the Skew-T tab. Selecting data, zooming, changing style, and saving of the plot are available in the same manner as for the XY Graph.
Meteorologists are accustomed to seeing a particular aspect ratio on skew-T plots and thus a consistent shape of the various isopleths. To maintain the correct aspect ratio when zooming, choose a zoom box whose lower left and upper right corners share a common temperature, i.e. they share a common diagonal. An example of a correct zooming rectangle is superimposed on the figure above.
Levels Tab
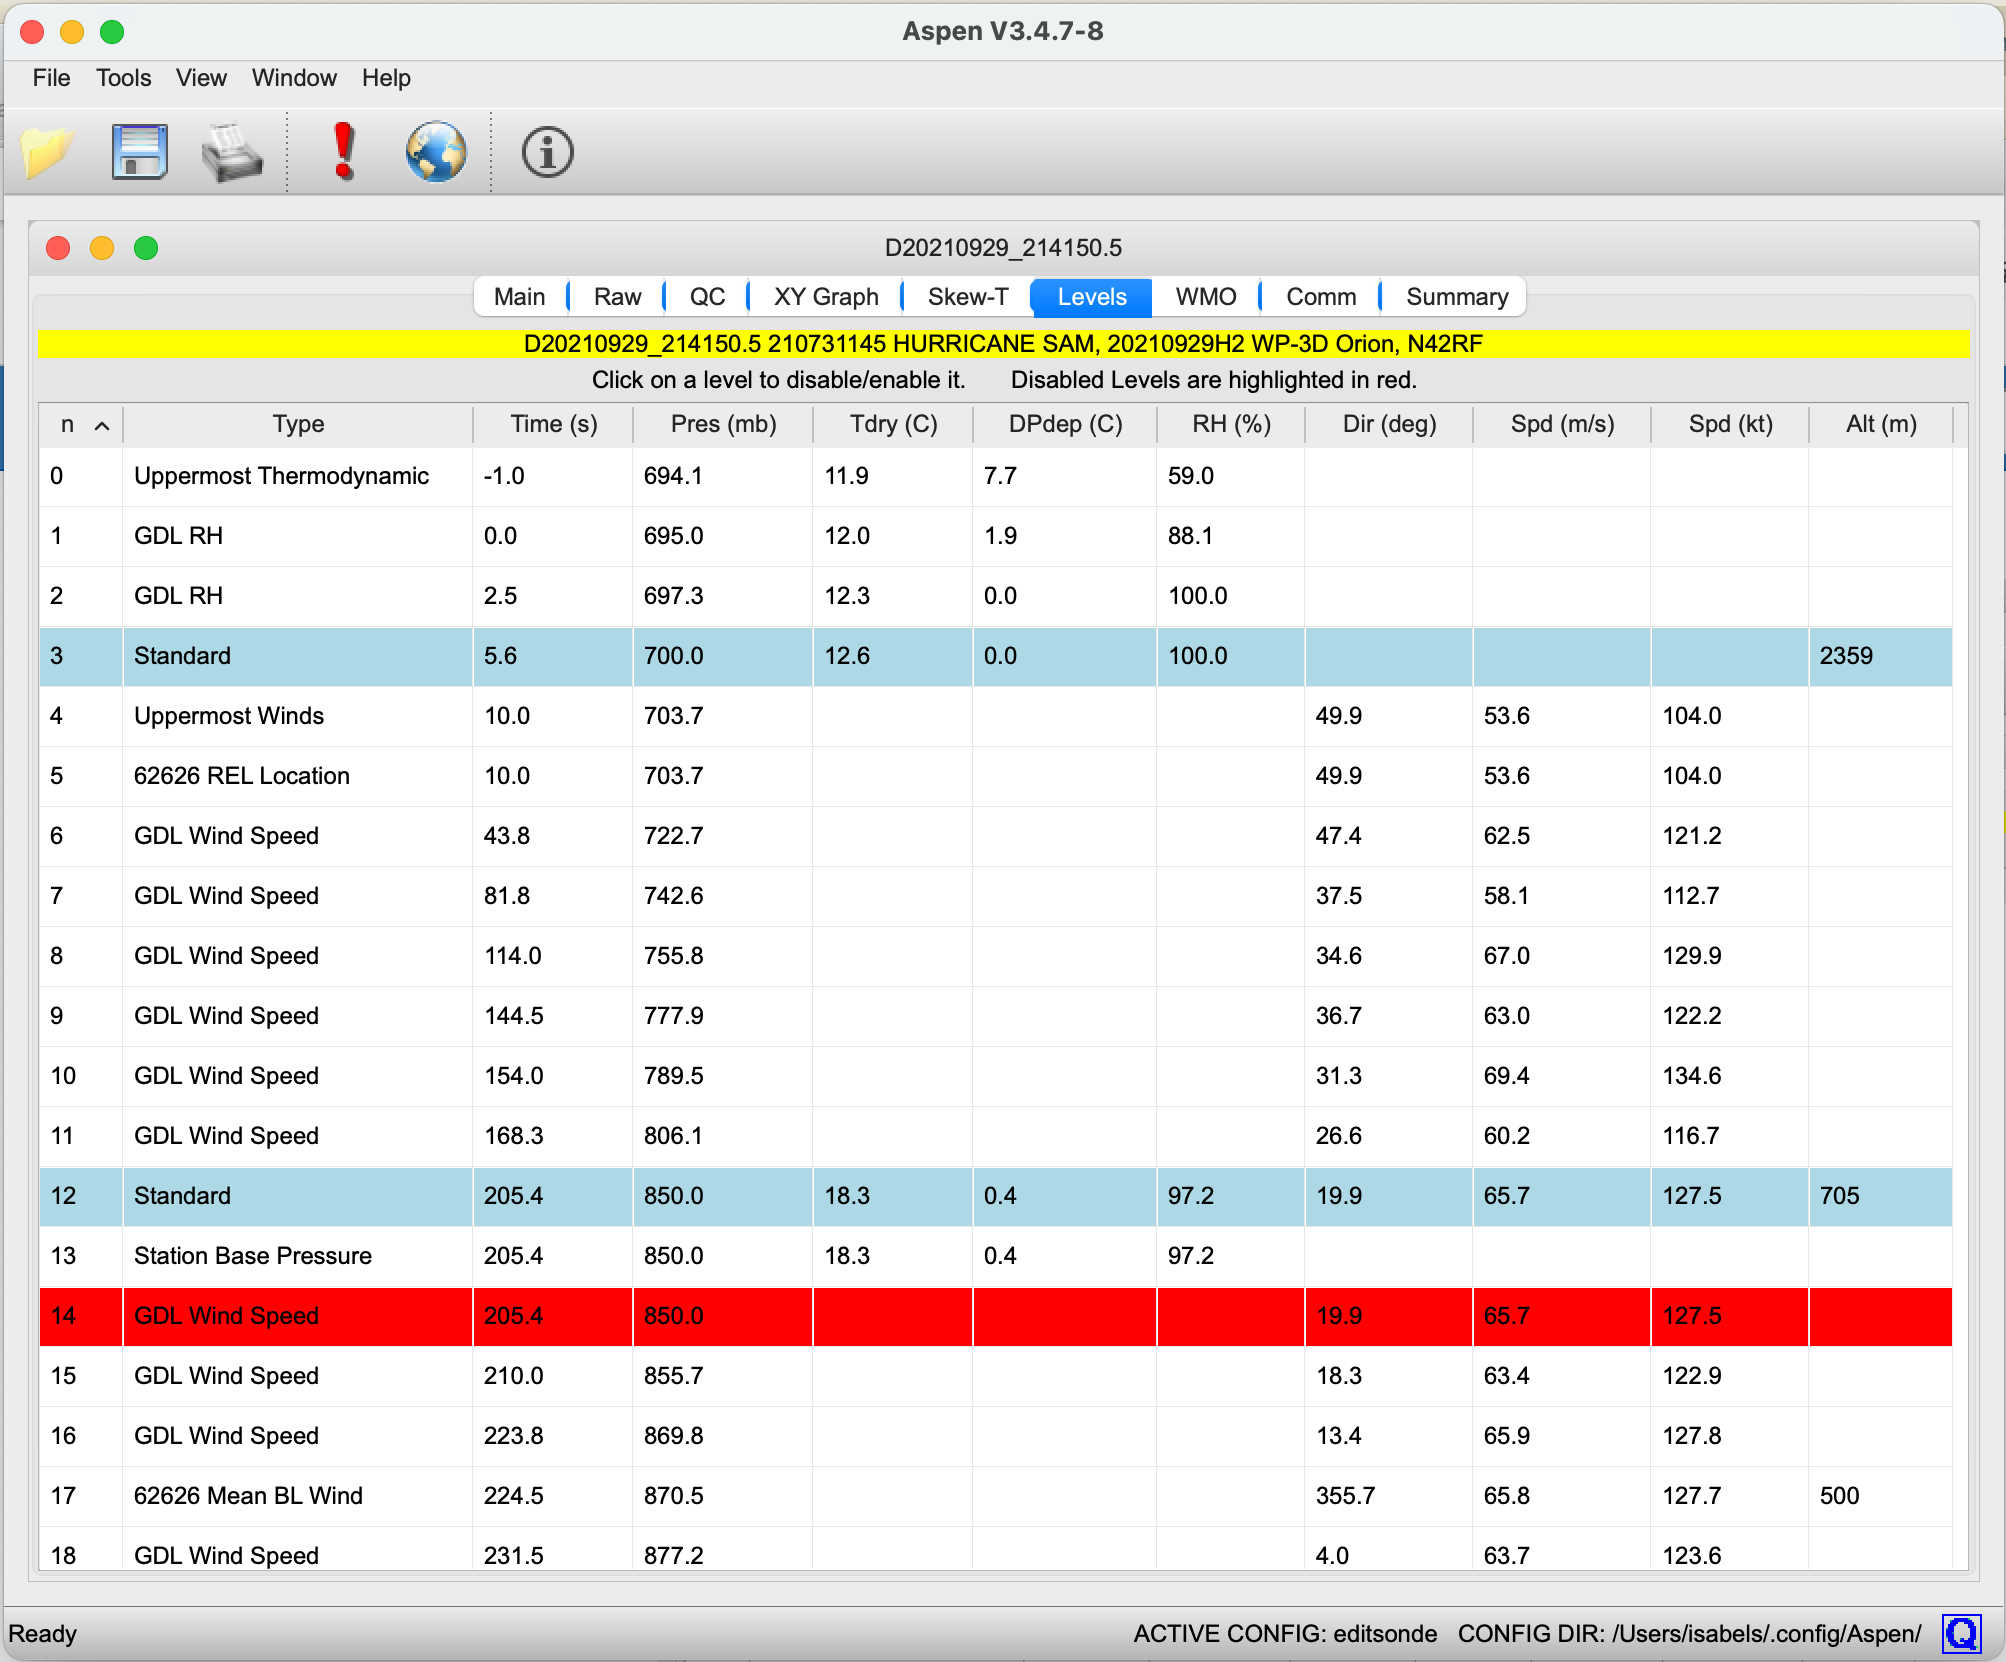
The Levels tab displays the computed levels, which have been derived from the QC data set. The surface and standard levels are highlighted in blue. These are the levels that are coded in parts A and C of the WMO message. The levels data can be printed and saved in CSV format from the Aspen toolbar.
The levels listing may be sorted by any of the variables by clicking on the desired column heading. Clicking a second time in the same heading reverses the order of the sorting. It is typical to sort either by time or pressure, both of which will give similar results. In certain cases the Aspen operator may wish to prevent particular levels from being coded in the WMO message. Clicking on a level in the Levels Tab will mark a level so that it is not coded. Excluded levels are highlighted in red, as shown in the above image. Click again on the level to toggle its status back for normal coding. Clicking on the temperature, RH, speed, direction or altitude fields will select that individual field and prevent it from being coded in the WMO message. Clicking on any other field (the columns to the left of these) will disable the whole level.
Not all variables are recorded for each level. This is because each level type is used to report only specific variables in the coded message. If a variable is not reported for a given level type, it is not calculated for that level.
WMO Tab
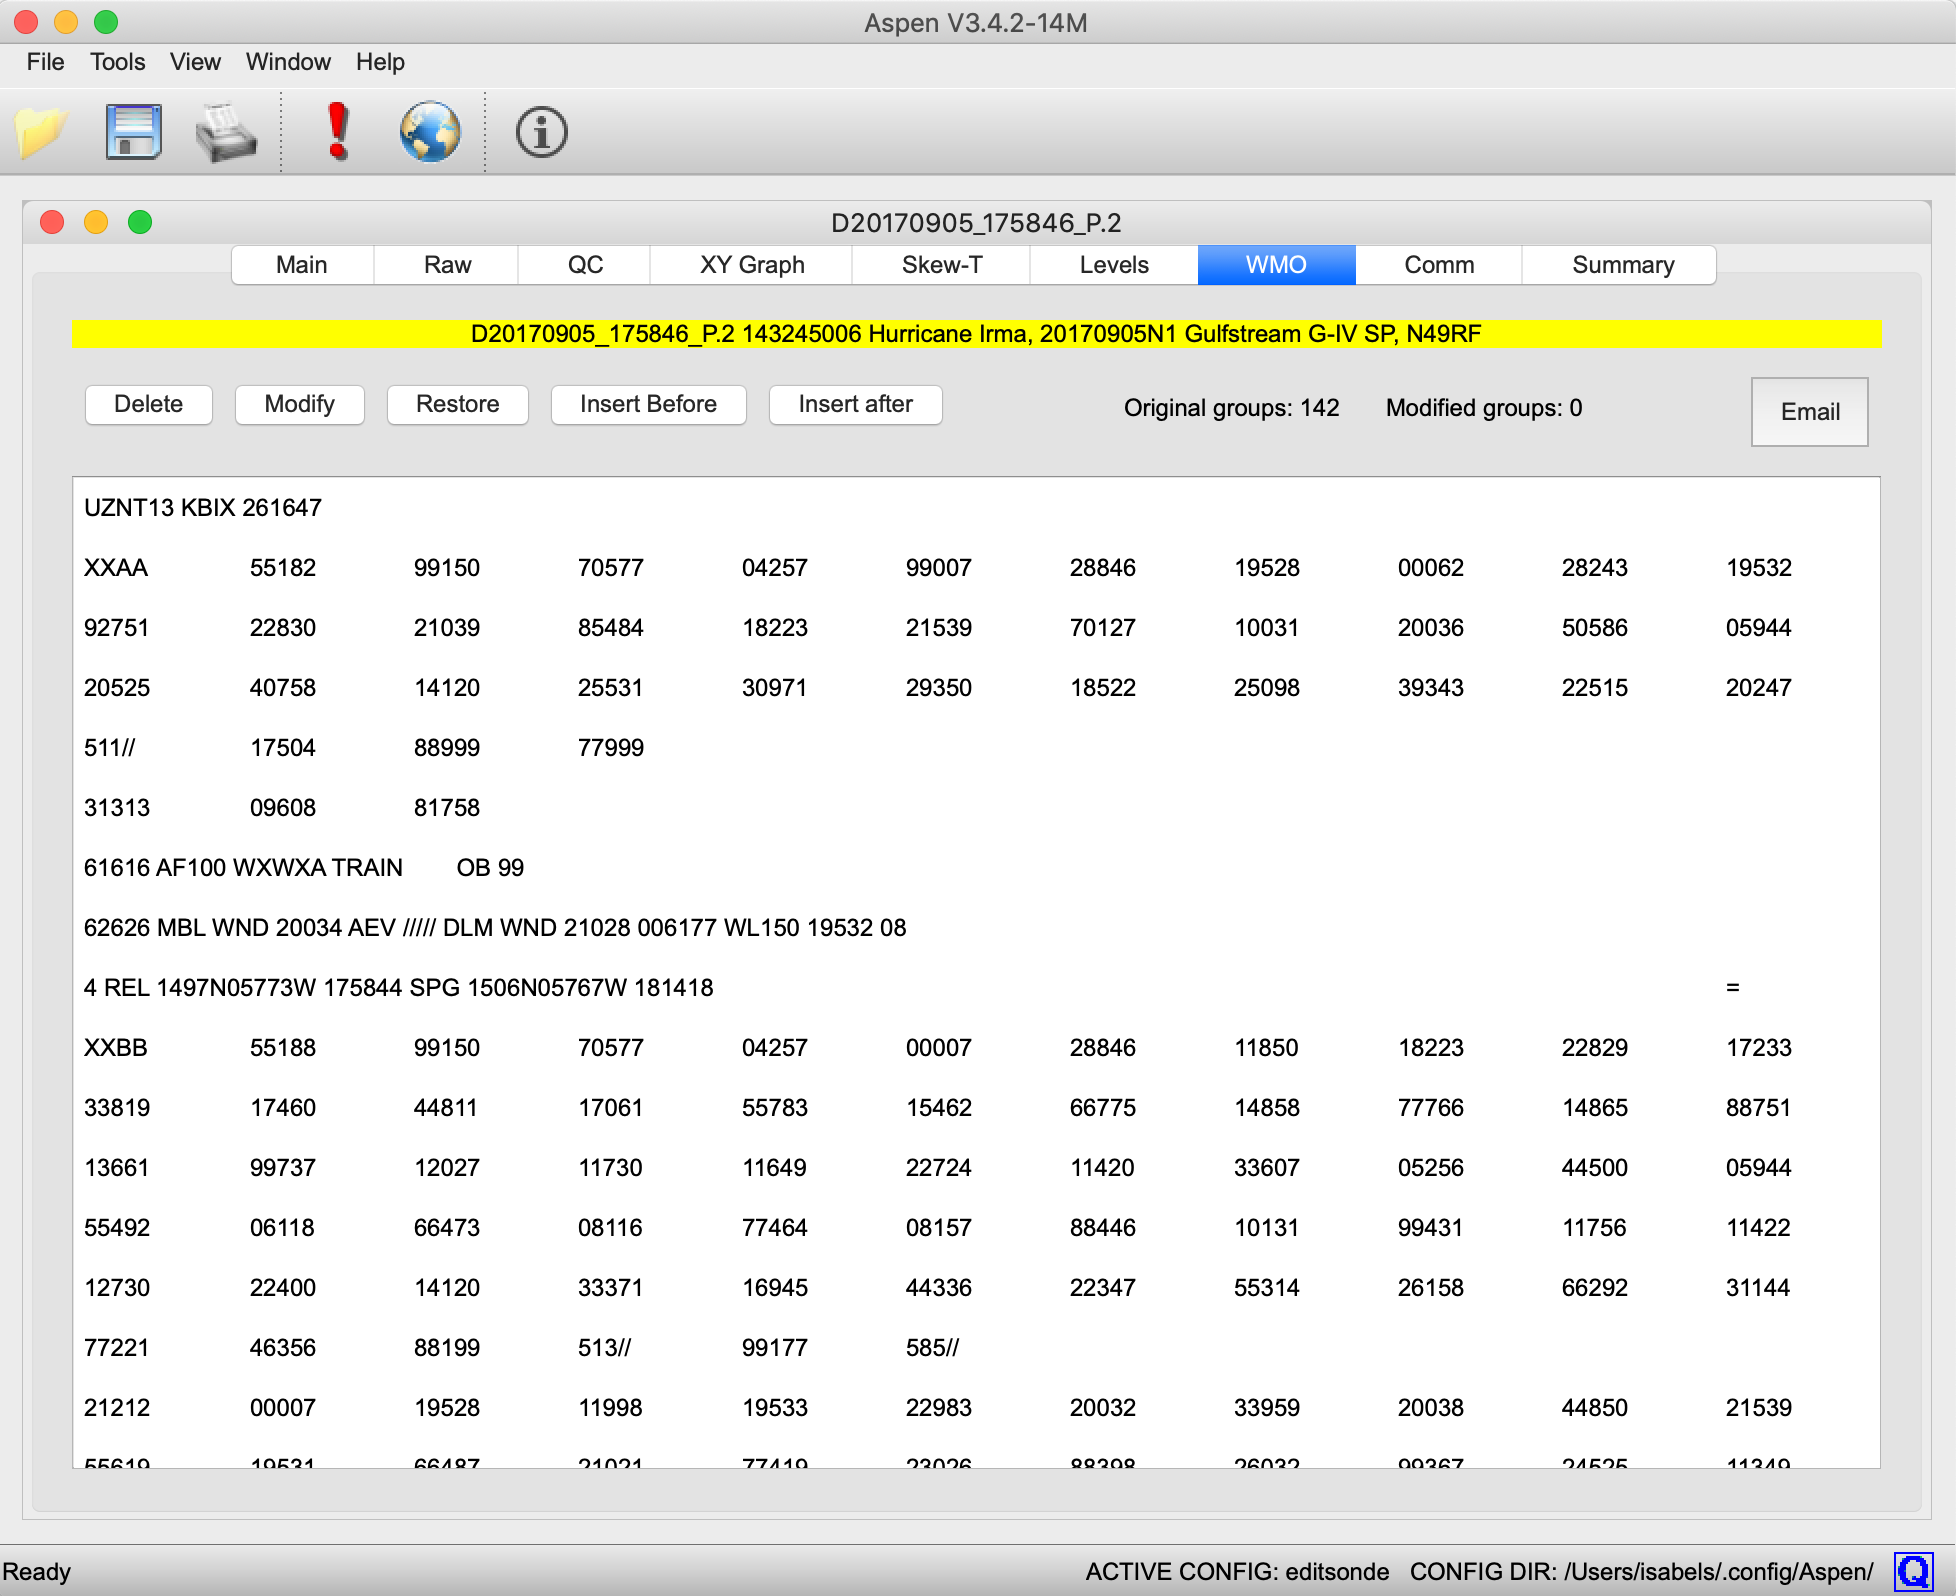
The WMO tab displays the WMO message, which has been coded from the levels information. It can be printed and saved as a .txt file using the Aspen toolbar.
The WMO message can be emailed from within Aspen by pressing the Email button on this tab. The email recipient is specified by the TempEmailAddress configuration parameter. When the Email button is pressed, the default operating system mail client (e.g. Outlook or Apple Mail) is started, and the user is presented with an email editing window. If the message is being mailed to an automatic processing system, such as the NWS email GTS ingest gateway, then the mail client should be configured to send in plain text format, and to not wrap the text lines. Group or alias entries can also be made in the client address book (e.g. “GTS”) to serve as the message recipient address.
The format for the WMO message is very exacting, and there may be times when Aspen does not get the coding quite right. The buttons at the top left of the WMO tab allow the user to modify the WMO message if necessary. Use the mouse to select the code group to be edited, and press the appropriate editing button.
There are a number of administrative entries in the WMO message that are not derived from the levels data. These are items such as the abbreviated header, and information in the 61616 and 62626 groups. This information is managed on the Comm tab. When a field is changed on the Comm tab, the WMO message is adjusted accordingly.
If the sounding analysis is recomputed, a new WMO message will be coded and any edits made previously will be lost.
Comm Tab
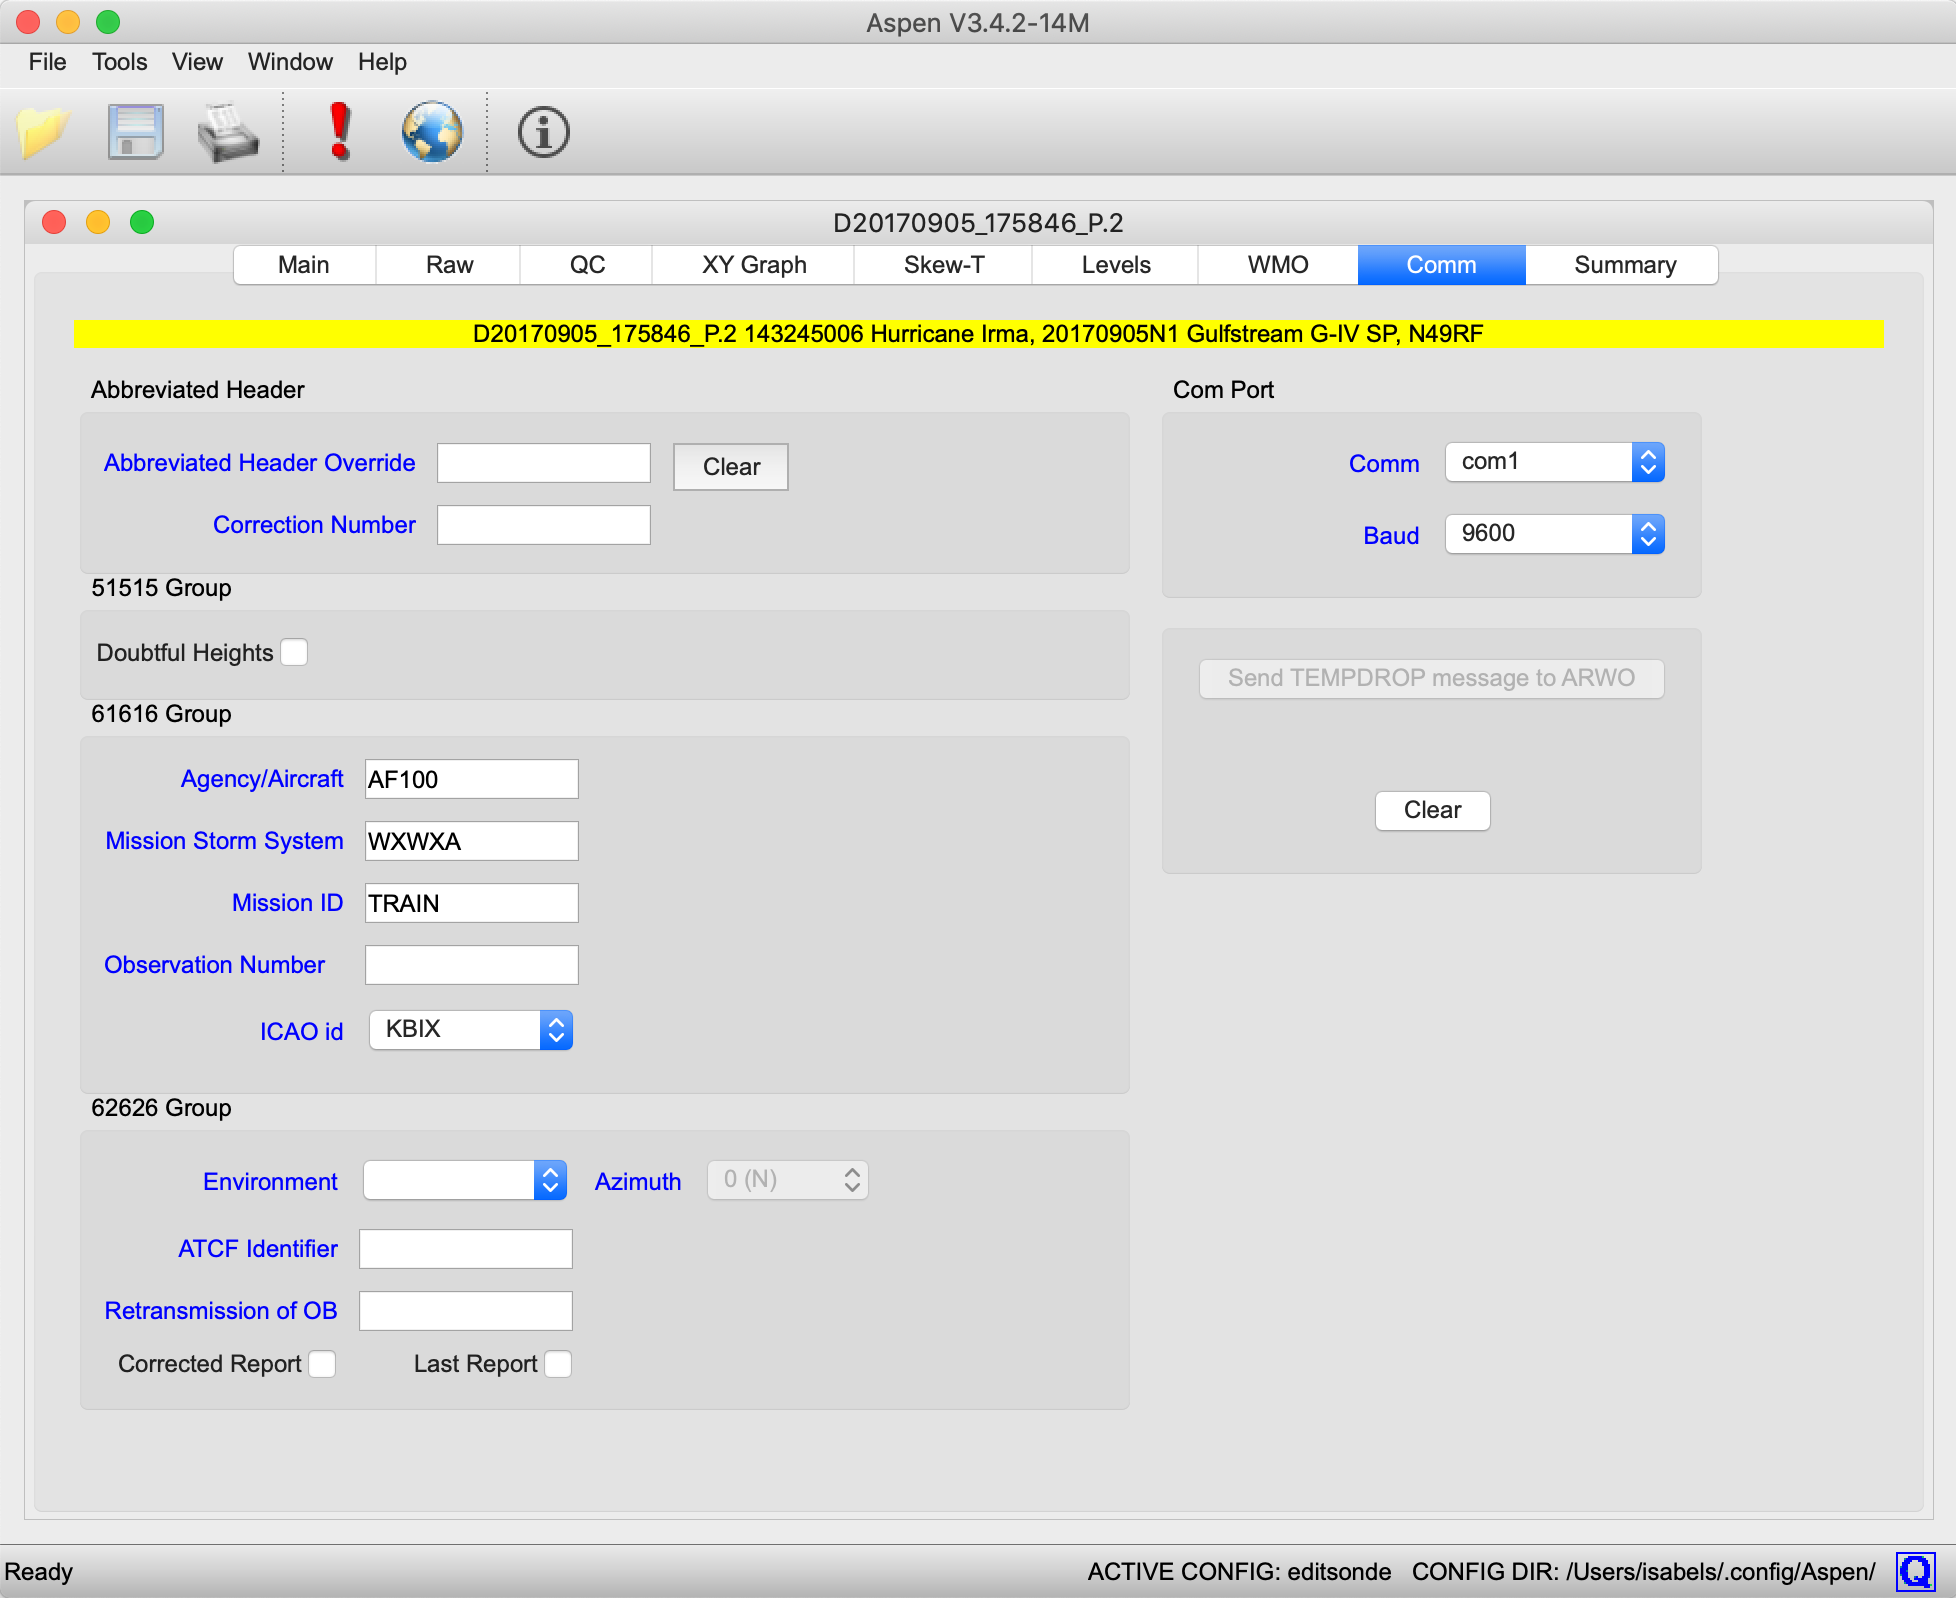
The Comm tab is used to enter the administrative information that is coded in the WMO message, primarily in dropsonde specific groups. It only appears if a dropsonde file is being analyzed. It also has controls for transmitting the WMO message via an attached interface on the USAFR WC130 aircraft. Press the “Send TEMPDROP message to ARWO” button to transmit the WMO message. A message box will pop up to indicate that the transmission is in progress.
Data entry fields in the Comm tab are applied to the TEMP message as soon as they are entered, so there is no need for the user to press recompute after changing fields. In addition, most fields are saved and automatically applied to the next sonde opened (with the exception of sonde-specific information, like OB number, correction number, environment, and corrected or last report).
Summary Tab
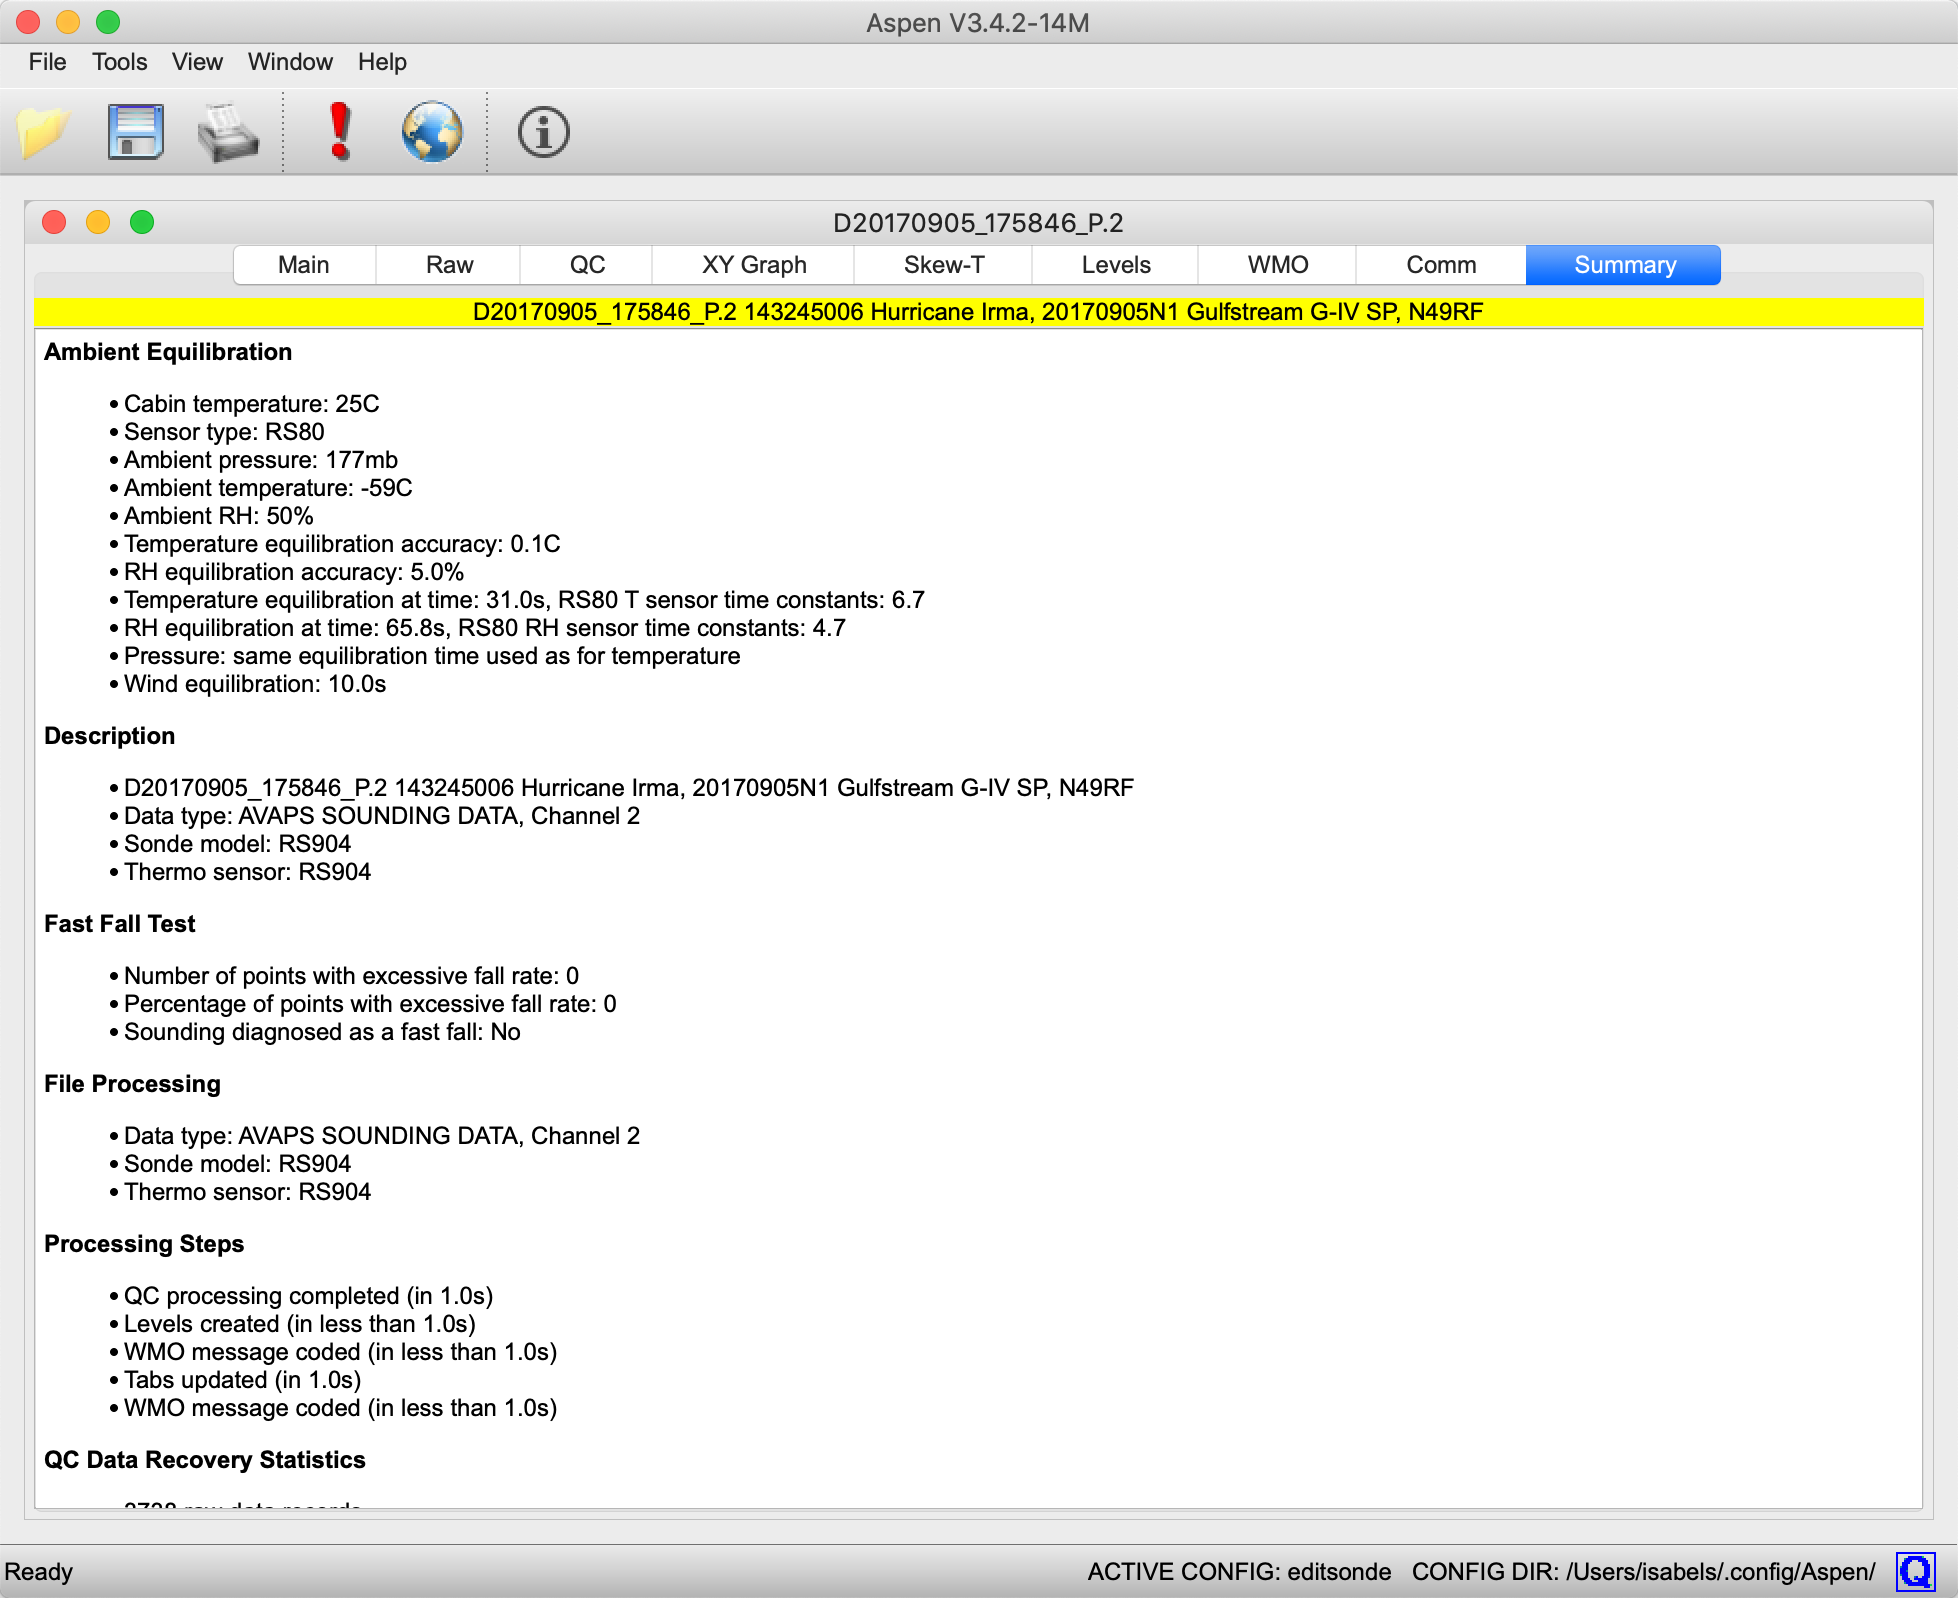
The Summary tab provides additional diagnostic information about the sounding input file and the processing Aspen has performed on it, including statistics about how many points are filtered out during processing and by which procedure. The information in the Summary tab can be printed or saved in PDF format using the Aspen toolbar.
Edit me